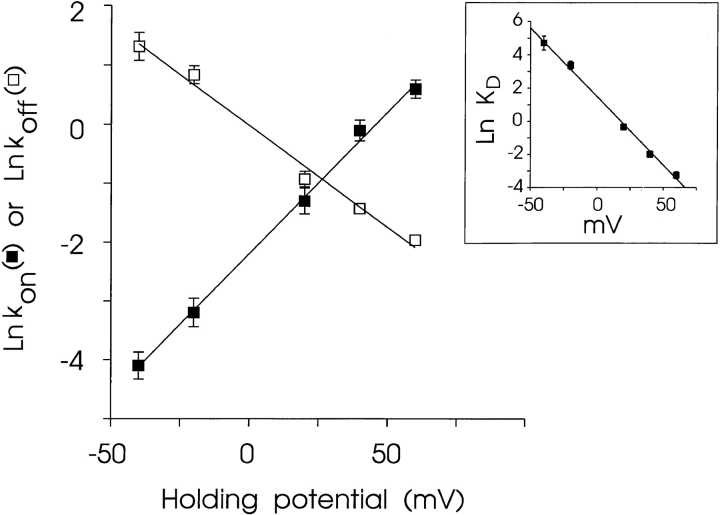
Figure 13.
Variation of association and dissociation rates of 21-amino-9α-hydroxy-ryanodine with holding potential. Rates were determined from the experiments depicted in Fig. 12 with 500 nM 21-amino-9α-hydroxy-ryanodine in the solution at the cytosolic face of the channel. Each point is the mean ± SEM of five to seven experiments. Where not visible, error bars are included within the symbol. The solid lines were obtained by linear regression with parameters quoted in the text. The inset shows the variation of the K d of 21-amino-9α-hydroxy-ryanodine (calculated from the data in Fig. 13 as K d = K off (s−1)/K on (μM−1 · s−1) with changing holding potential.

