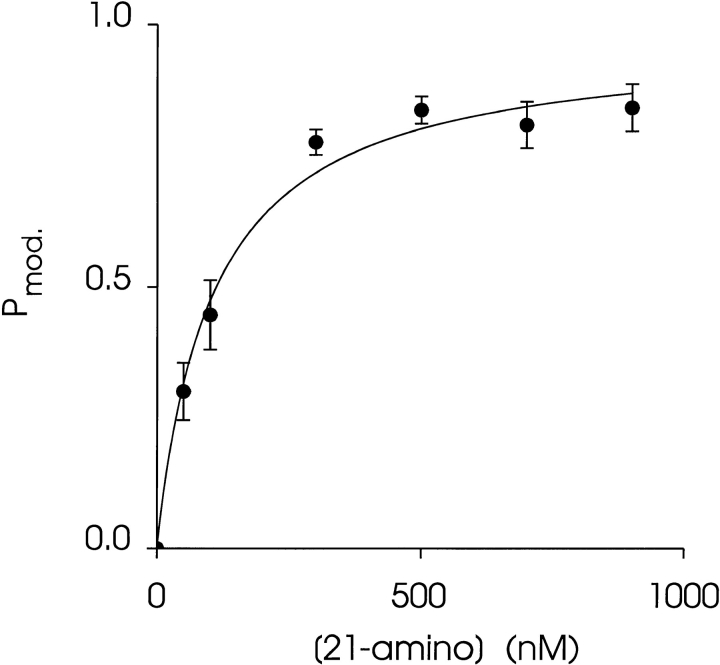
Figure 5.
The relationship between P mod, the concentration of 21-amino-9α-hydroxy-ryanodine in the solution at the cytosolic face of the channel. P mod was determined by monitoring dwell times in the unmodified and modified conductance states in 6-min recordings at +40 mV. Each point is the mean ± SEM of at least four experiments. The curve is drawn according to a single-site binding scheme (Eq. 3), with the parameters P max = 0.97 and K d = 105 nM obtained by nonlinear regression.

