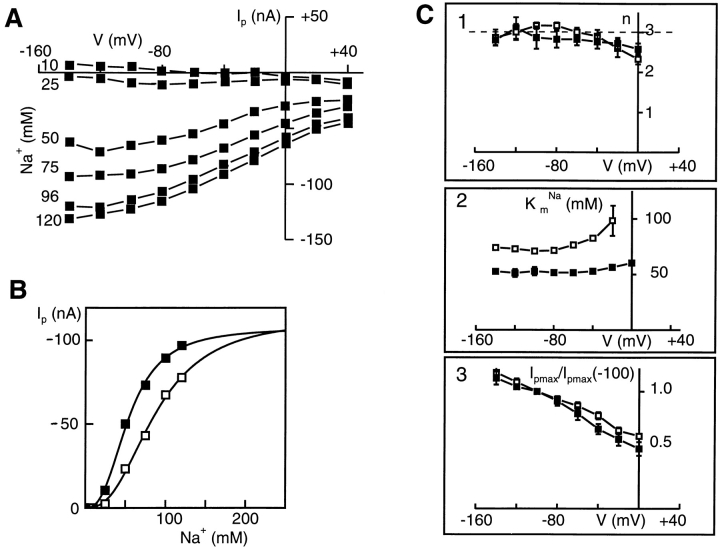
Figure 3.
Steady state voltage dependency of Na+/Pi transport as a function of Na+ concentration. (A) Typical family of I-V curves obtained from one cell with 1 mM Pi and six Na+ concentrations as indicated (millimolar). Data points are joined for visualization only. (B) Typical dose-response data for the same cell at two Pi concentrations: 1.0 (▪) and 0.1 (□) mM with Na+ as the variable substrate and Vh = −50 mV. Eq. 1 was fit to the data points. For this cell, the fit parameters were: (1 mM Pi) K m Na = 50.1 mM, n = 2.6, Ipmax = 109 mM; and (0.1 mM Pi) K m Na = 89 mM, n = 2.6, Ipmax = 114 mM. (C) Summary of voltage dependence of fitted parameters comparing data for two concentrations of Pi: 1 (▪) and 0.1 (□) mM. Data are shown as mean ± SEM. Only SEMs exceeding symbol size are shown. Data points are joined for visualization only. (C, 1) n = Hill coefficient, (dashed line) n = 3; (C, 2) K m Na = apparent affinity constant; (C, 3) Ipmax/Ipmax(−100) = maximum induced current normalized to the value at −100 mV.

