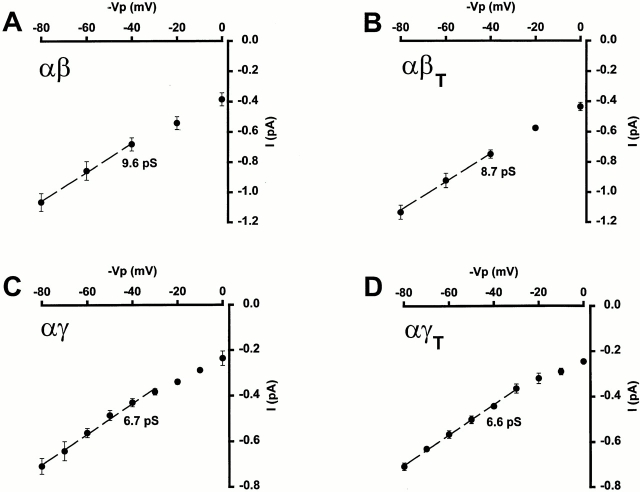
Figure 3.
Current (I )–voltage (V ) relationships for αβ (A), αβT (B), αγ (C), and αγT (D). Single channel conductance was estimated by linear regression either between −40 and −80 mV (A and B) or −30 and −80 mV (C and D) and is represented by the dashed line. The pipette solution contained 150 mM Li+. Each point is the mean ± SEM of three experiments. In this and all subsequent figures, where no error bars are shown, the error was within the symbol.

