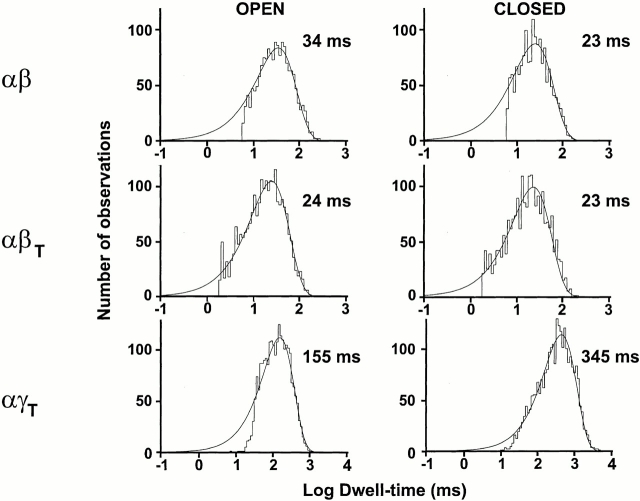
Figure 6.
Examples of open and closed time histograms for αβ, αβT, and αγT in the presence of amiloride. Data was obtained from single channel patches. Fits were done using Pstat. All histograms were best fitted with one exponential. The y ordinate in all histograms corresponds to the number of observations and the x ordinate log dwell-time (milliseconds). Numbers to the right of each histogram represent the calculated closed or open times for the given example.

