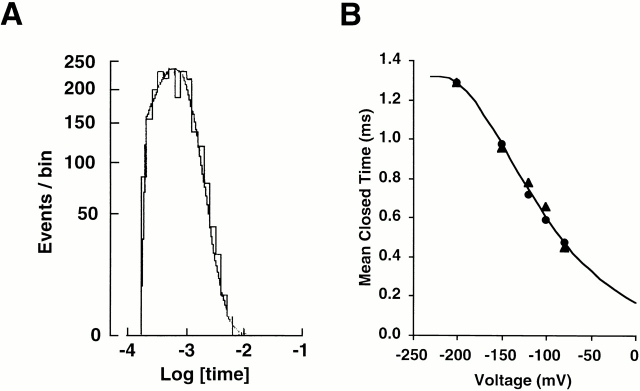
Figure 8.
Effect of Rb+ only (110 Rb+) solution in the pipette. (A) Closed-time histogram at −100 mV. The histogram was well described by one exponential distribution with a time constant of 0.65 ms. (B) Voltage dependence of closed times. The values of the best fit obtained with Eq. 9 were ΔU 2 = 11 kBT, δ2 = −0.15, and ΔU 3 = 17 kBT. δ3 was set to be 0.2. Individual data from two experiments are shown.

