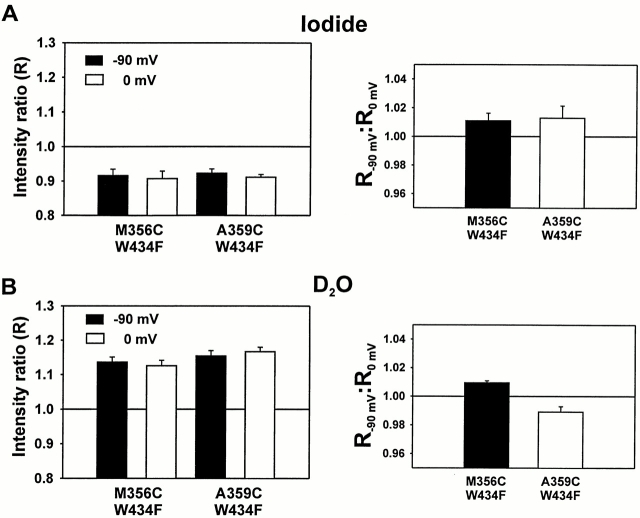
Figure 10.
Effects of collisional quenchers on TMRM fluorescence near the S4 segment. (A, left) The intensity ratio for constructs M356C W434F and A359C W434F was computed by dividing the fluorescence intensity after the application of 50 mM KI + 70 mM NMG-Mes by the fluorescence intensity before iodide application. Values <1.0 indicate a decrease in fluorescence after application. Fluorescence intensities were measured at either −90 (black) or 0 (white) mV, with error bars representing SEM (M356C, n = 7; A359C, n = 4). The statistical likelihood of no effect (P) was calculated as the probability of obtaining these statistics, given a true ratio of 1. For all four measurements, P < 0.01. (right) Ratio of the iodide intensity ratio at −90 mV (R−90 mV) to intensity ratio at 0 mV (R0 mV) for constructs M356C W434F and A359C W434F, with error bars = SEM (M356C, n = 7; A359C, n = 4). Values >1 indicate that the intensity ratio at −90 mV is larger than the intensity ratio at 0 mV. M356C, P < 0.05; A359C, P = 0.13. (B, left) The intensity ratio for constructs M356C W434F and A359C W434F was computed by dividing the fluorescence intensity after the application of 120 mM NMG-Mes in D2O by the fluorescence intensity before D2O application. Values >1.0 indicate an increase in fluorescence after application. Fluorescence intensities were measured at either −90 (black) or 0 (white) mV, with error bars = SEM (M356C, n = 6; A359C, n = 6). For all four measurements, P < 0.01. (right) Ratio of the D2O intensity ratio at −90 mV (R−90 mV) to intensity ratio at 0 mV (R0 mV) for constructs M356C W434F and A359C W434F, with error bars = SEM (M356C, n = 6; A359C, n = 6). Values <1 indicate that the intensity ratio at −90 mV is smaller than the intensity ratio at 0 mV. For both measurements, P < 0.01.

