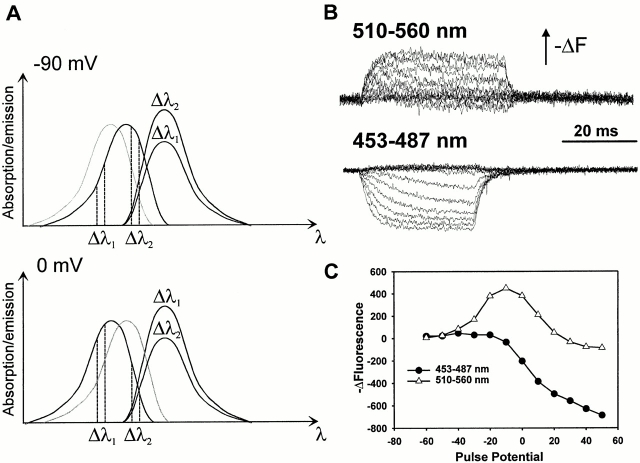
Figure 13.
Voltage-dependent excitation shift observed near the S2 segment. (A) This diagram illustrates how a theoretical shift in excitation spectrum can lead to a change in the direction of the fluorescence signal as a function of excitation wavelengths. At −90 mV, a theoretical excitation spectrum (dark trace, top panel) yields increased fluorescence emission when excited at wavelengths Δλ2 compared with Δλ1. At 0 mV, when a shift of the excitation spectrum to shorter wavelengths (to the left) occurs, as seen by the new excitation spectrum (dark trace, bottom panel), the relative fluorescence intensities at wavelengths Δλ1 and Δλ2 reverse. Thus, when exciting at Δλ1 during a pulse from −90 to 0 mV, the fluorescence intensity would increase; when exciting at Δλ2 during the same pulse, the fluorescence intensity would decrease. (B) Changes in fluorescence for construct D270C T449Y when exciting at two different wavelengths: 510–560 nm (top, average of 10 sweeps), and 453–487 nm (bottom, average of 25 sweeps). These changes were evoked in response to 40-ms pulses from −90 mV to potentials from −60 to 50 mV. Upward deflection of the trace indicates a decrease in fluorescence intensity (−ΔF). (C) Fluorescence change (−ΔF) at the end of a 40-ms pulse from −90 mV for the two different excitation wavelengths. Negative values indicate an increase in fluorescence. The curves correspond to excitation wavelengths 453–487 nm (•) and 510–560 nm (▵).

