
Figure 14.
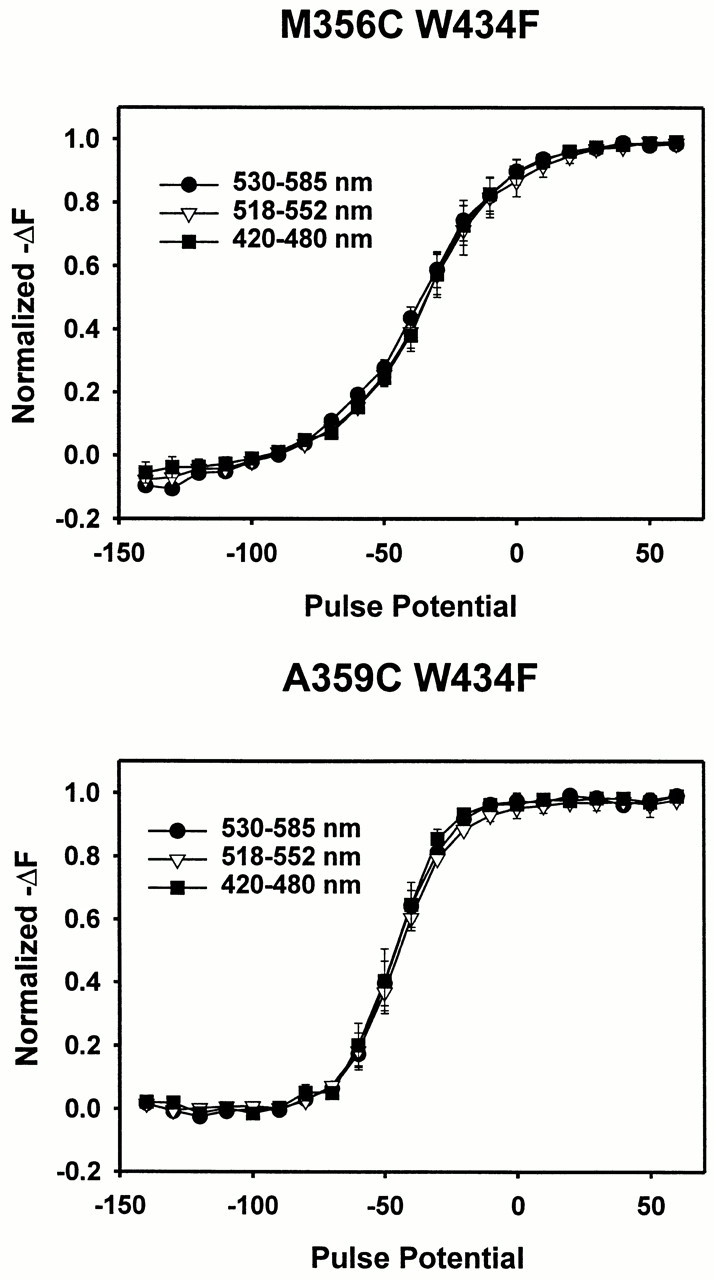
Absence of a voltage-dependent excitation shift near the S4 segment. (A) Normalized decrease in fluorescence (−ΔF) as a function of voltage for M356C W434F at three different excitation wavelengths: 530–585 nm (•), 518–552 nm (▿), and 420–480 nm (▪). The fluorescence was measured at the end of a 40-ms pulse from a holding potential of −90 mV. Error bars = SEM (n = 4). (B) Normalized decrease in fluorescence as a function of voltage for A359C W434F at three different excitation wavelengths, using the same symbols described above. Error bars = SEM (n = 3).