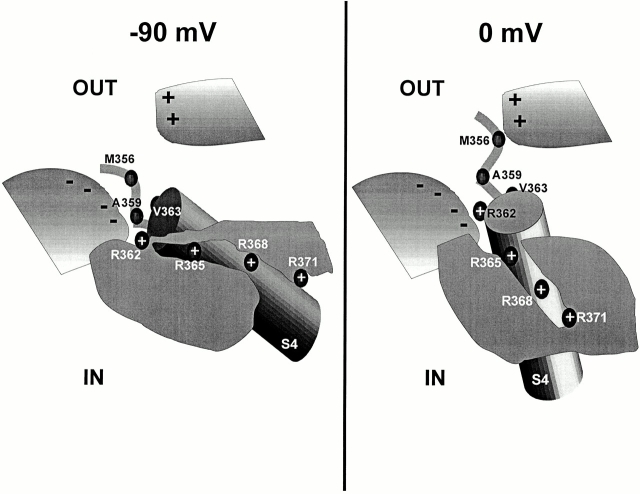
Figure 15.
Illustration of the protein vestibule near the S4 segment. (left) Visualization of the vestibule characteristics near the S4 segment at −90 mV. The vestibule is shown as two white-to-gray shaded regions, one negatively charged (bottom left) and one positively charged (top right), next to the extracellular loop of the S4 segment. The gray region represents the hydrophobic region where the electric field is focused, and the cylinder represents the S4 segment. (right) Visualization of the vestibule characteristics near the S4 segment at 0 mV. Site M356C is more constrained here than at −90 mV, whereas sites A359C and V363C are less constrained. As above, the vestibule is shown as two white-to-gray shaded regions next to the extracellular loop of the S4 segment, and the gray region represents the hydrophobic region.

