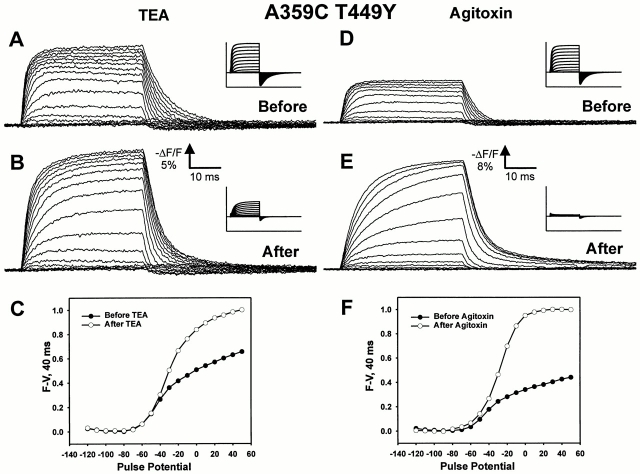
Figure 4.
Effects of pore blockers TEA and agitoxin on fluorescence quenching for construct A359C T449Y. (A) Fluorescence traces for A359C T449Y before the application of external 120 mM TEA-Mes, taken in 40-ms pulses from a holding potential of −90 mV to potentials between −120 and 50 mV. Ionic currents (inset) were recorded with internal 120 mM K-Mes solution and external 10 mM K-Mes solution before the addition of TEA, with a current scale of 60 μA and time scale of 102 ms. The traces shown were taken as single sweeps. (B) Same as A, taken after application of external 120 mM TEA-Mes. (C) Plot of fluorescence change at the end of the 40-ms pulse as function of pulse potential, normalized to the largest fluorescence change observed during the experiment, before (•) and after (○) application of TEA. (D) Same as A, taken before application of ∼3 μM agitoxin 2. (E) Same as B, taken after application of ∼3 μM agitoxin 2. (F) Same as C, before and after application of agitoxin.

