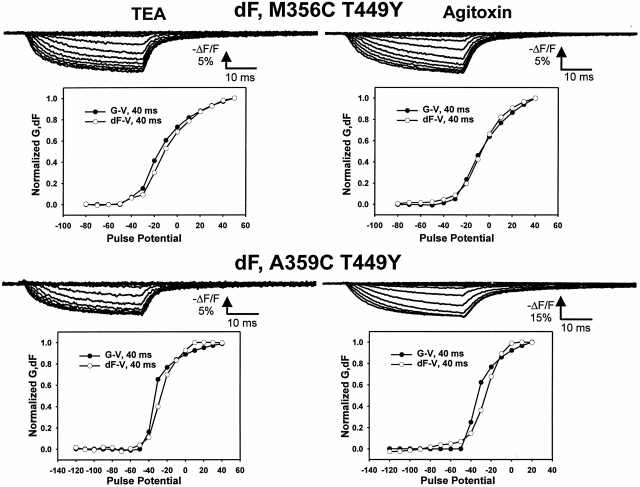
Figure 5.
Characteristics of the fluorescence difference near the S4 segment after the application of pore blockers. (top left) The fluorescence difference traces, computed as the fluorescence before TEA minus the fluorescence after TEA application as a function of pulse potential for M356C T449Y, taken from a holding potential of −90 mV to potentials between −120 and 50 mV. (bottom left) A comparison of the voltage dependence of ionic conductance (•) and fluorescence difference (○), taken at the end of a 40-ms pulse from a holding potential of −90 mV. (top right) Same as top left, but using agitoxin in place of TEA. (bottom left) Same as top left, for A359C T449Y with TEA. (bottom right) Same as bottom left, but using agitoxin in place of TEA.

