
Figure 7.
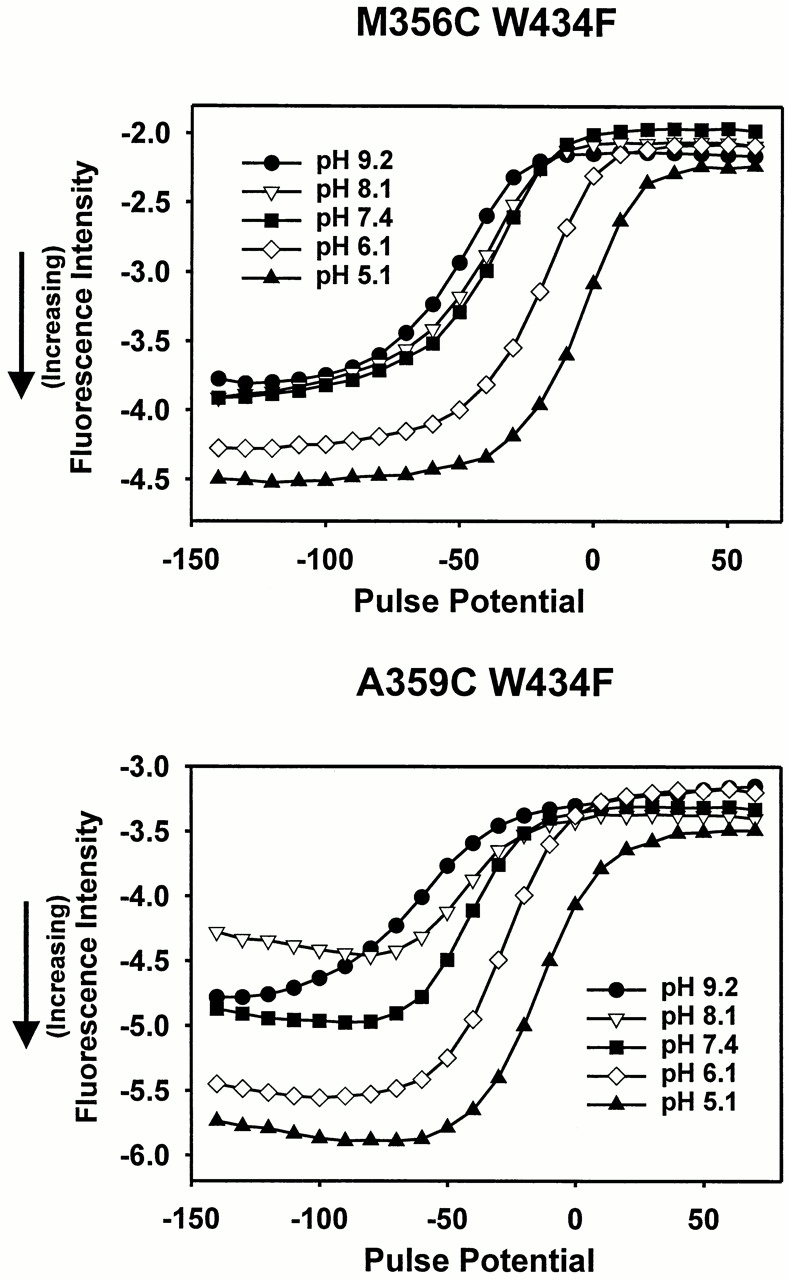
pH-dependent modulation of TMRM fluorescence near the S4 segment. (top) Fluorescence intensity for M356C W434F, taken at the end of a 40-ms pulse from a holding potential of −90 mV, for five different external pH values: 9.2 (•), 8.1 (▿), 7.4 (▪), 6.1 (⋄), and 5.1 (▴). Larger negative fluorescence values indicate an increase in intensity. The fluorescence intensities were measured starting at pH 9.2, going through 8.1, 7.4, 6.1, to 5.1, and then returning through 6.1, 7.4, 8.1, to 9.2, and averaging pre- and post-pH 5.1 intensity measurements for the same oocyte. For this experiment, an offset was applied to subtract a large amount of the background fluorescence. (bottom) Fluorescence intensity for A359C W434F, taken at the end of a 40-ms pulse from −90 mV, for the same pH values, using the symbols and protocol described above.