
Figure 8.
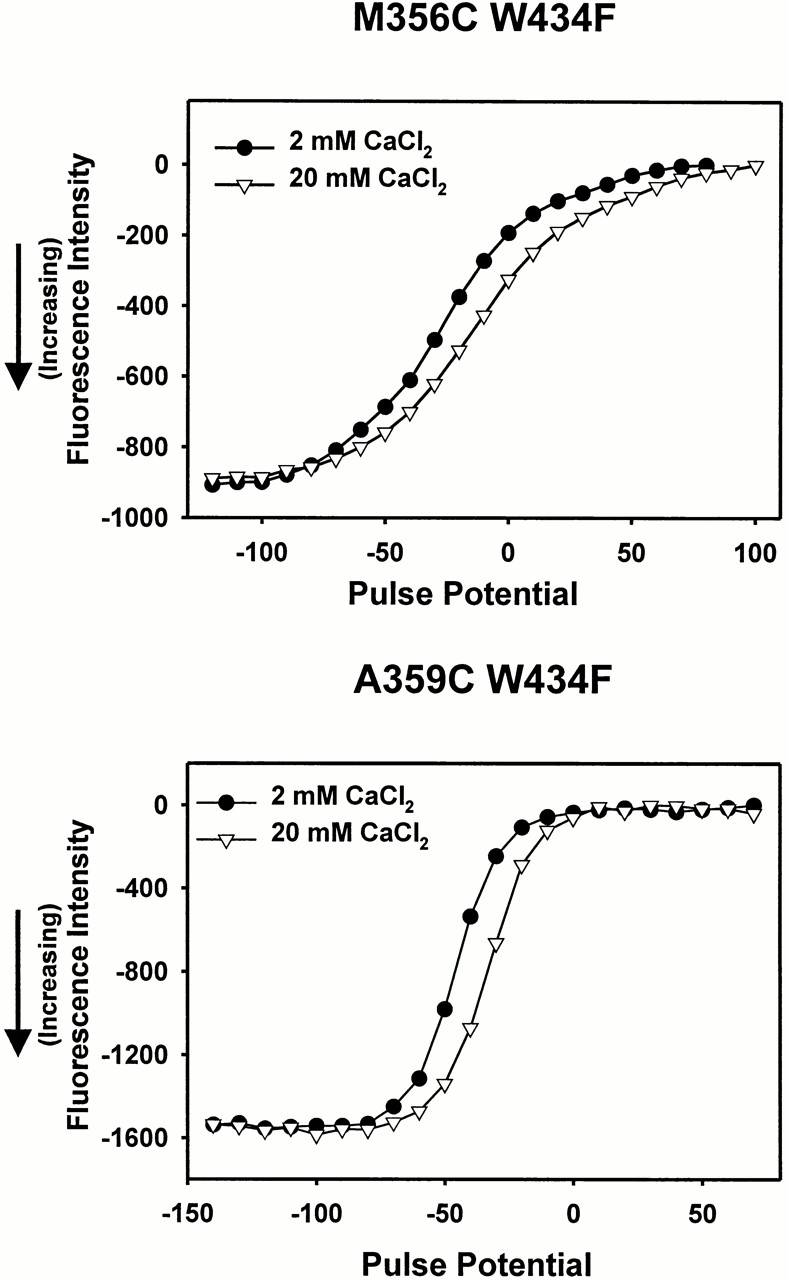
Effects of changing CaCl2 concentration on TMRM fluorescence near the S4 segment. (top) Fluorescence intensity for M356C W434F, taken at the end of a 40-ms pulse from a holding potential of −90 mV, in the presence of 2 (•) and 20 (▿) mM CaCl2 for the same oocyte. (bottom) Fluorescence intensity for A359C W434F, taken at the end of a 40-ms pulse from a holding potential of −90 mV, in the presence of 2 (•) and 20 (▿) mM CaCl2 for the same oocyte.