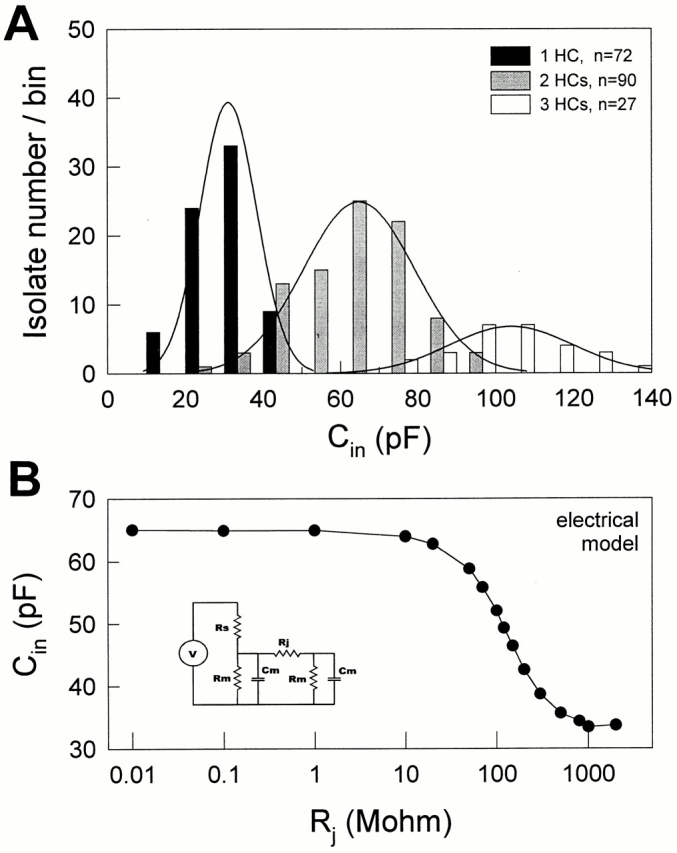
Figure 1.

(A) The distributions of C in of Hensen cell (HC) isolates. The cell numbers (1, 2, or 3) in the isolates were determined under the light microscope, and the C in was obtained at the holding potential −80 mV. Each bar represents the number of isolates within a bin width of 10 pF. The lines plotted over each histogram represent the fitted Gaussian distribution for the three isolate groups. (B) C in was measured for a coupled two-cell electrical model as transjunctional resistance (R j) was changed. R s, 4.7 MΩ; R m, 500 MΩ; C m, 33 pF. (inset) Coupled two-cell electrical model.
