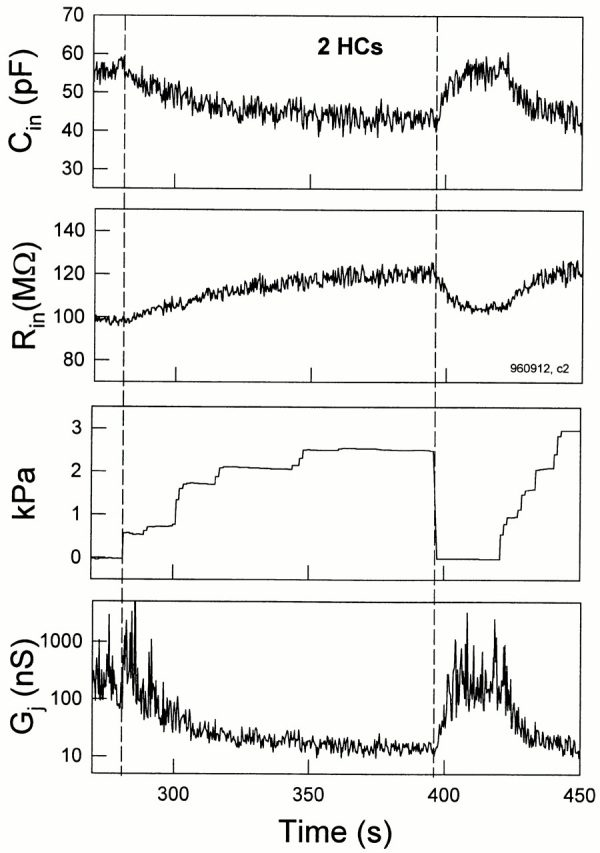
Figure 8.

Transjunctional conductance is estimated by C in and R in in single pipette voltage clamp. (top) C in decreased and R in simultaneously increased as turgor pressure increased. C in and R in followed changes in pressure. R s, 8.73 MΩ. (bottom) G j is estimated from C in and R in measurements from the cell pair data based on the coupled two-cell model. C m was set as half of C in, 27.5 pF, at zero applied pressure, and R s was 8.5 MΩ. The change in estimated G j corresponds well to changes in C in. The magnitude of G j is larger than the largest obtained under double voltage clamp (∼500 nS), and may be due to the fact that cell impedances are not actually identical as required in the model.
