
Figure 10.
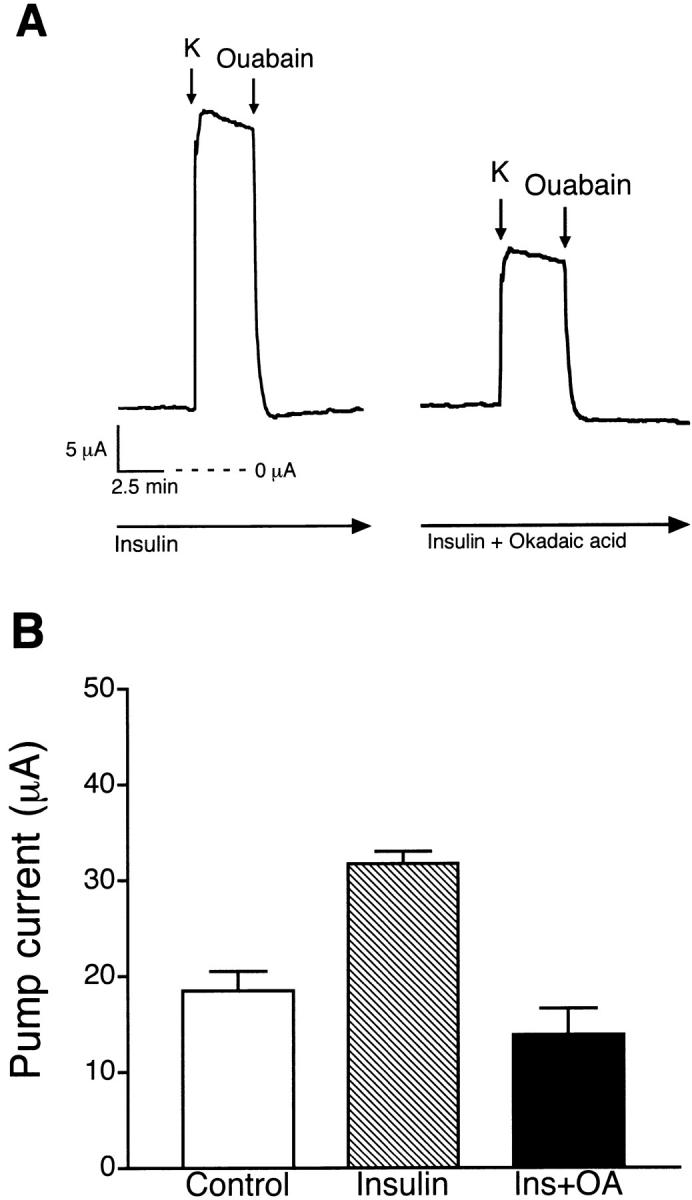
Effect of okadaic acid on insulin-stimulated pump current. (A) Representative tracing comparing pump current responses of insulin (850 nM)-treated monolayers before and after pretreatment with okadaic acid (100 nM). (B) Histogram illustrating the effect of okadaic acid on insulin activation of K+-stimulated pump current (n = 6, N = 4) compared with insulin (n = 7, N = 4) and a serum-free control group (n = 12, N = 5).