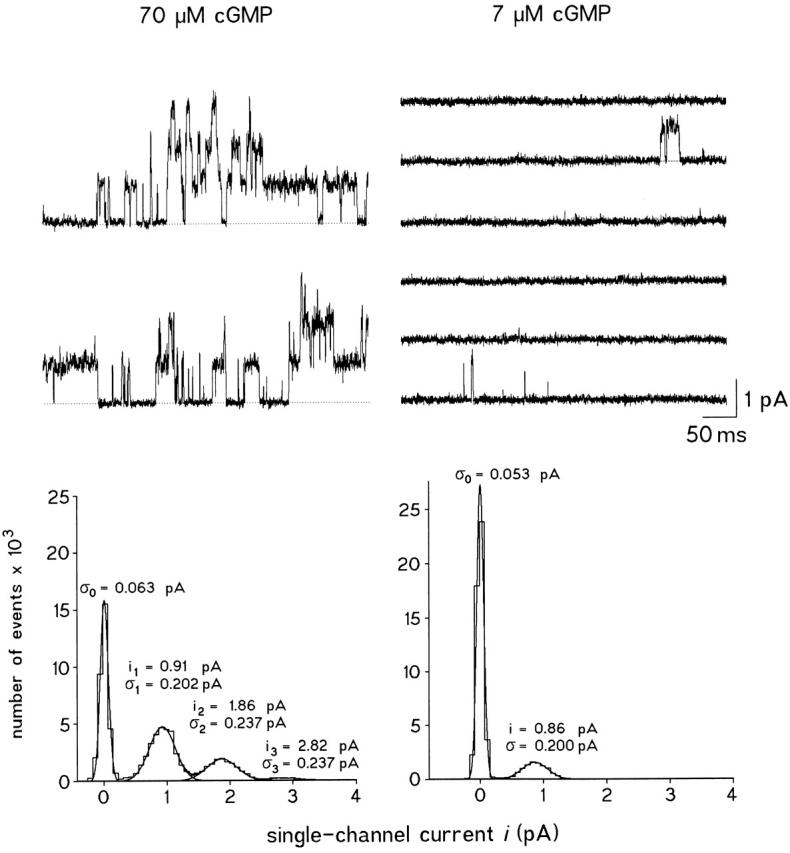
Figure 1.

Single-channel currents and corresponding amplitude histograms in a patch containing at least three CNG channels at 70 (left) and 7 (right) μM cGMP. The patch was held at +50 mV. The individual traces of 500-ms duration were recorded in intervals of 1 s. The final cut-off frequency was 1 kHz. The amplitude histograms were formed with the variance-mean technique with a window width of 280 μs (seven sampling points). The distributions were fitted with sums of either four or two Gaussian functions. The respective single-channel currents i and standard deviations σ are indicated. At 70 μM cGMP, the amplitude histograms were formed from consecutive traces, whereas at 7 μM cGMP only nonempty traces were used. Significant sublevel openings were not present.
