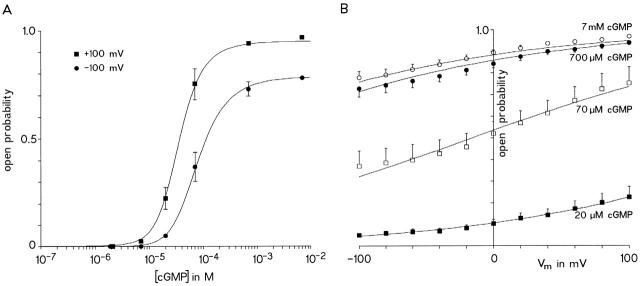
Figure 6.
Voltage and [cGMP] dependence of macroscopic current. (A) Dose–response relationships for the channel activation by cGMP at +100 and −100 mV. The error bars indicate SD; for several conditions, SD is smaller than the size of the symbols. Three different types of measurements were used to determine the dose–response relationships (see text). Each data point was calculated from 4–10 individual experiments. The data points at the two voltages were simultaneously fitted with the allosteric model (Fig. 1; see text for parameters). (B) P o/Vm relationships at 20, 70, and 700 μM, and 7 mM [cGMP]. In the diagram, the data points at −100 and +100 mV were taken from A. The data points for all other voltages were obtained from the instantaneous tail currents at −100 mV after test pulses to the indicated voltages at the abscissa (compare Fig. 5). The error bars indicate SD that was computed according to the error propagation law. The curves provide the best simultaneous fit to all data with the allosteric model (see text for parameters).

