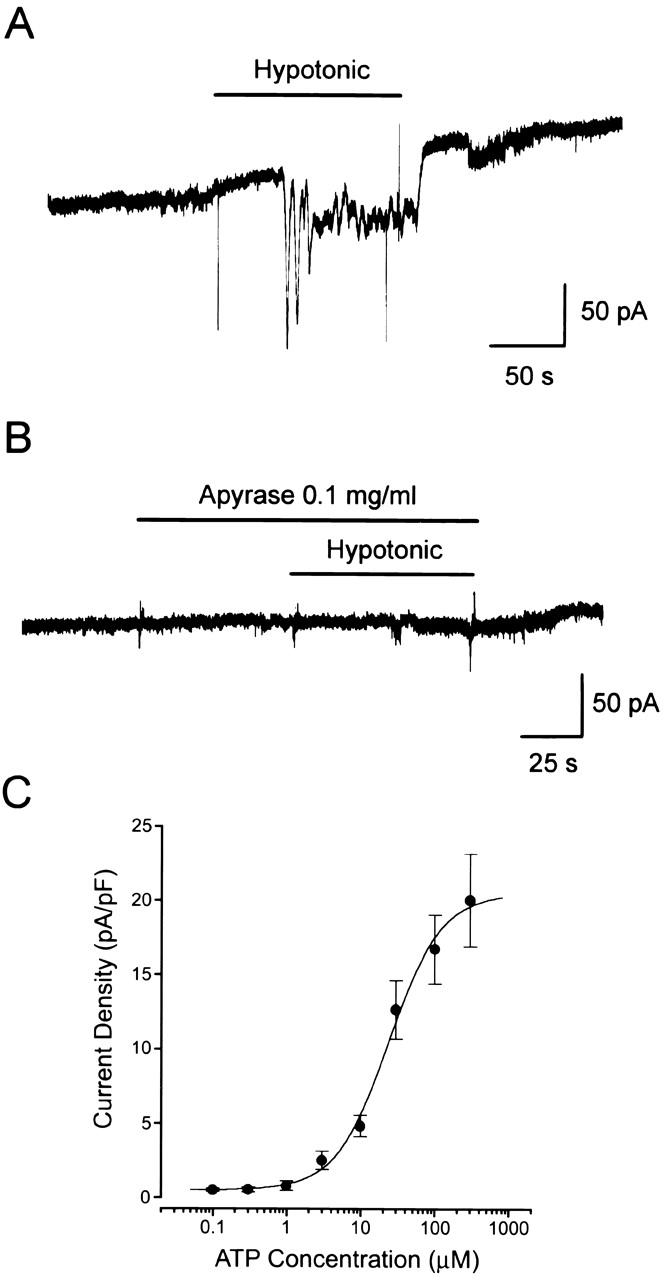
Figure 2.

Cell surface release of ATP upon osmotic swelling detected by the biosensor technique. (A) Representative trace of control records from PC12 cells placed close to an Intestine 407 cell in response to a hypotonic challenge. (B) Representative trace of the current response to a hypotonic challenge in the presence of 0.1 mg/ml apyrase in the bath solution. A similar result was obtained from four cells. (C) Concentration–response curve of the ATP-induced currents in PC12 cells. Each symbol represents the mean peak current density of 4–13 observations (with SEM, vertical bar) in response to application of a single puff of ATP. The mean input capacitance of PC12 cells employed in these experiments was 14.5 ± 0.99 pF (n = 32).
