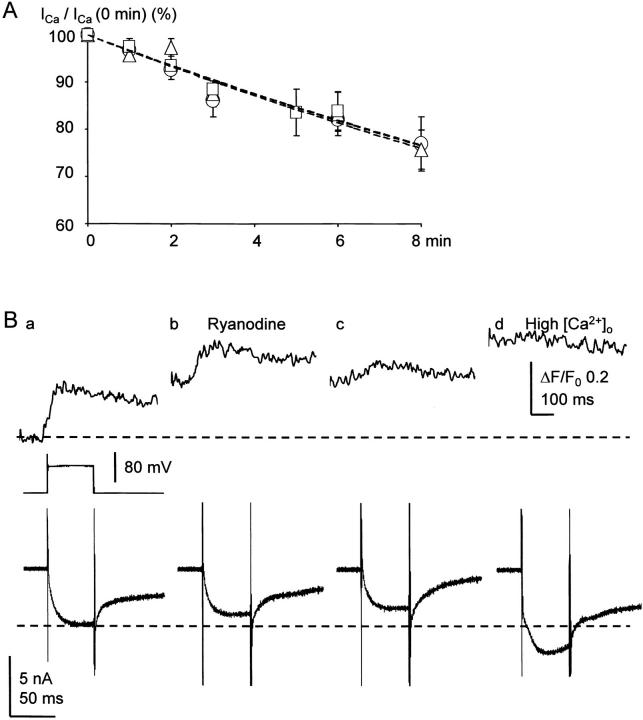
Figure 8.
No effects of thapsigargin and ryanodine on Ca2+ currents and their rundown and no restoring effect of high Ca2+ on the Ca2+ transients suppressed by CICR blockers. (A) The time courses of Ca2+ current rundown in the absence and presence of thapsigargin or ryanodine. A depolarizing voltage pulse from −75 to 0 mV (10–50 ms of the pulse duration) evoked Ca2+ currents. Open circles with a vertical bar indicate the mean ± SEM of the peak amplitudes of Ca2+ currents in the absence of a blocker (n = 24), whereas triangles and squares with a vertical bar are those in the presence of thapsigargin (1 μM; n = 19) and ryanodine (10 μM; n = 13), respectively. Each data point for CICR blockers was normalized to the amplitude before the application of the blockers. Dashed lines are the results of single exponential fitting with time constants of 29.2 min for the control, 30.0 and 30.2 min for those in the presence of thapsigargin and ryanodine, respectively. (B) No restoring effect of high extracellular Ca2+ on the Ca2+ transients suppressed by CICR blockers. Upper and lower traces represent Ca2+ transients (in fluorescence ratio change (ΔF/F0); to show the less possibility of the dye saturation) and Ca2+ currents induced by voltage pulses of 50 ms from −75 to 0 mV (shown in the middle trace) at 15 (a), 25 (b), 30 (c), and 35 min (d) after the opening of a membrane patch. Ca2+ transients were measured from the region of 5-μm width beneath the cell membrane. Ryanodine (10 μM) was applied immediately after the record (a). The extracellular Ca2+ concentration ([Ca2+]o) was raised to 10 mM after the end of the record (c).

