
Figure 2.
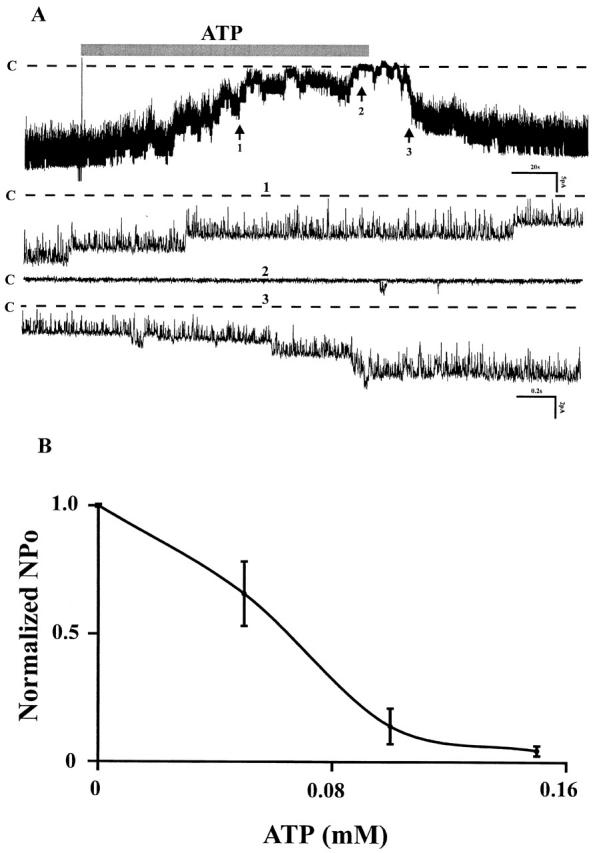
(A) Channel recording showing the affect of external ATP (100 μM) on the apical small-conductance K channel of mouse CCD. Dotted lines and C indicate the channel closed states. The three parts on the bottom (1, 2, and 3) were extended at fast time resolution corresponding to the regions numbered 1, 2, and 3 at top. (B) The dose–response curve of ATP affect on the K channel activities. Experiments were carried out in cell-attached patches. The half maximal inhibitory concentration for ATP was K i = 64 μM.