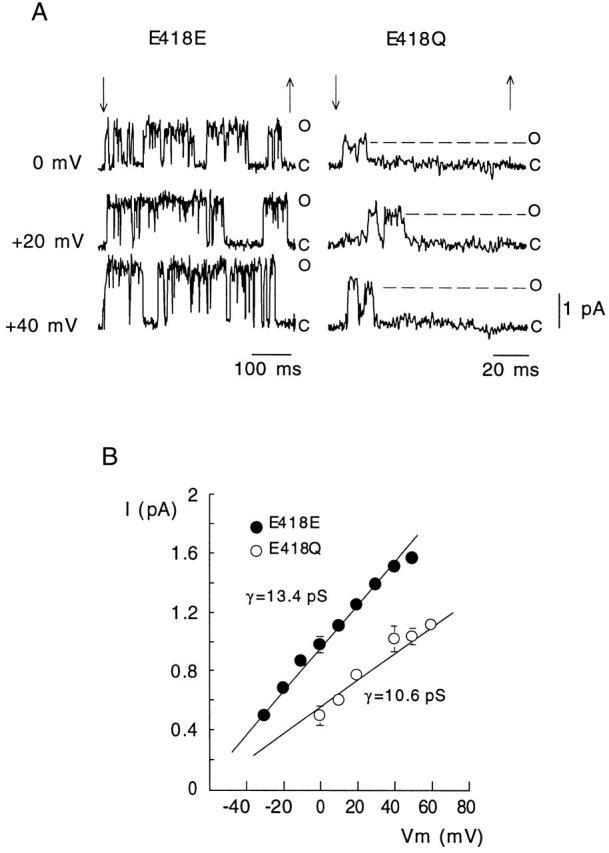
Figure 6.

Comparison of single-channel currents recorded in outside-out patches that seemed to contain only one wild-type (E418E) or mutated (E418Q) channel. (A) Examples of current records during application of depolarizing pulses (between the arrows) to the indicated membrane potentials. The current levels indicating the closed (C) and open (O) states of the channels are shown. Extra- and intracellular [K+] were 2.7 and 130 mM, respectively. (B) Plot of single-channel current amplitude as a function of the membrane potential in the two channel types exposed to the indicated asymmetrical [K+]. Data points are the mean and the vertical bars are the standard deviation of measurements done in three (E418E) and six (E418Q) cells. The straight lines are linear regression fits to the data points with slopes giving values of the average single-channel conductance (γ).
