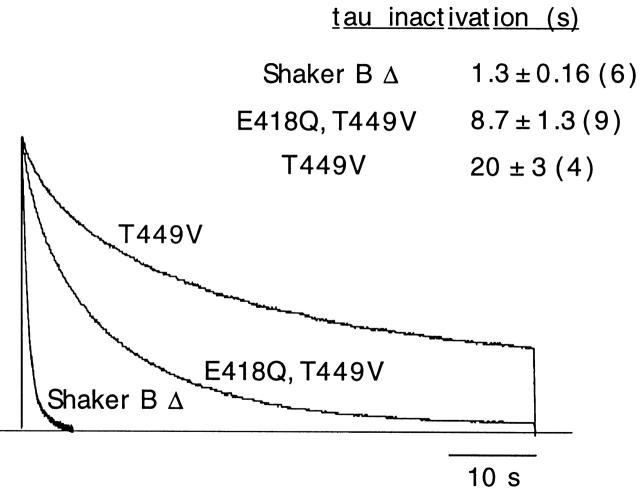
Figure 7.
Comparison of C-type inactivation time courses of Shaker BΔ channels and of mutants at position 449 alone (T449V) or at positions 449 and 418 (E418Q, T449V). Pulses of 60 s applied from −80 to +20 mV. Mean ± SD (number of experiments is shown in parentheses) of inactivation time constants in the three channel types are also indicated in the figure.

