
Figure 7.
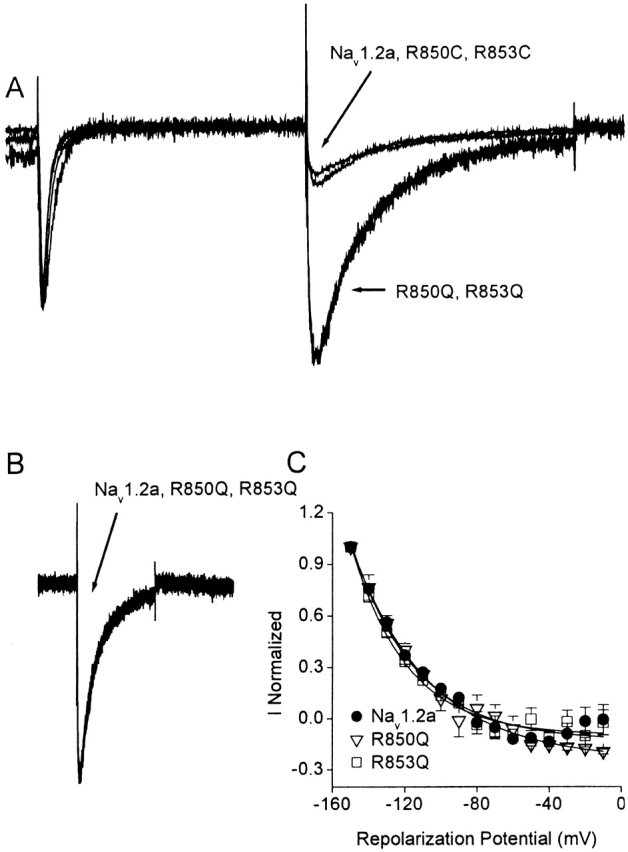
Css IV-induced tail currents. (A) Whole-cell currents elicited by a 28-ms test pulse to −20 mV followed by a repolarization to −150 mV from a holding potential of −100 mV in the presence of 200 nM Css IV for wild-type Nav1.2a, R850Q, R853Q, R850C, and R853C sodium channels. Each trace was normalized to the maximal amplitude of the peak sodium current. Each trace is an average of at least four recordings. (B) Comparison of the time course of the Css IV-induced tail currents for Nav1.2a, R850Q, and R853Q. The data were normalized to the maximal amplitude of the toxin-induced tail current. (C) Amplitude of the toxin-induced tail current as a function of the repolarization potential for Nav1.2a (black circle), R850Q (open triangle), and R853Q (open square) sodium channels in the presence of 200 nM Css IV.