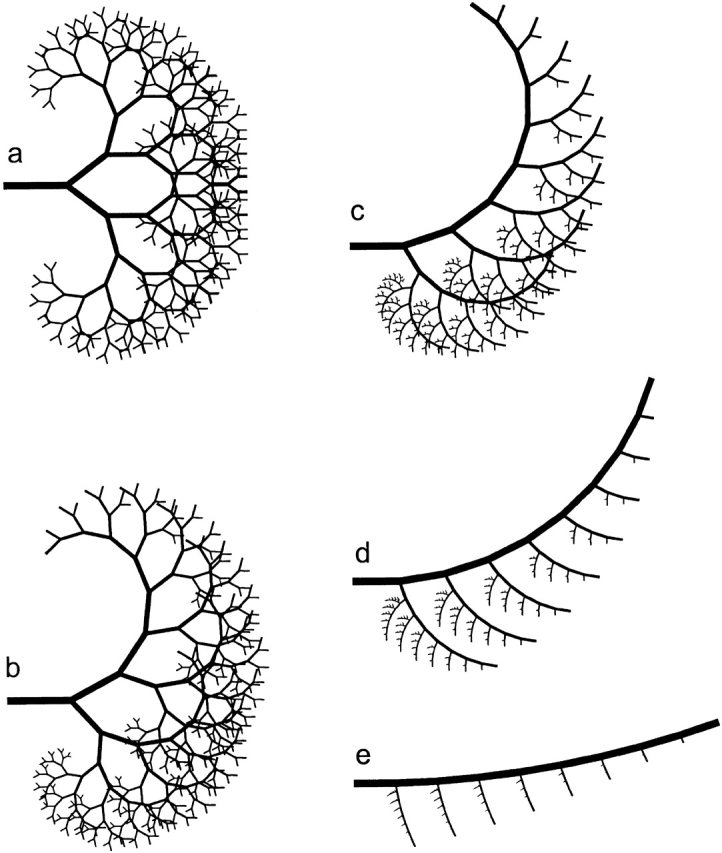
Figure 8.

The ninth stage of tree structures generated by , with the parameters being determined by the value of the bifurcation index α, which is a measure of asymmetry of the bifurcations that make up the tree. (a) α = 1.0, which corresponds to perfectly symmetrical bifurcations; (b) α = 0.8; (c) α = 0.6; (d) α = 0.4; and (e) α = 0.2. Although α is constant in each tree, the lengths and diameters of branches diminish as the tree pro-gresses.
