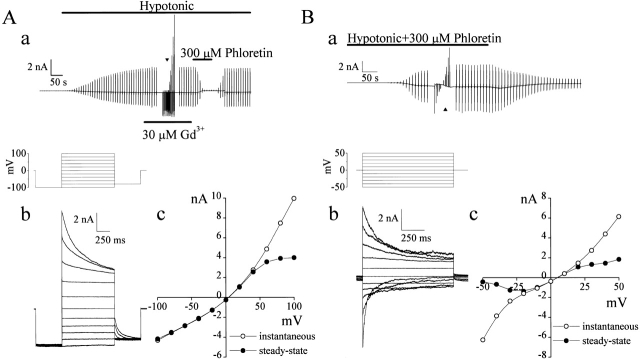
Figure 1.
Two different types of whole-cell currents induced by osmotic swelling. (A) VSOR Cl− currents recorded from a C127i cell dialyzed with pipette solution containing 5 mM ATP. (a) Representative record during application of alternating pulses from 0 to ±50 mV (every 10 s) or of step pulses from −100 to +100 mV in 20-mV increments at the arrowhead (protocol is shown in the inset). Horizontal bars indicate times during the application of hypotonic solution, and with the addition of 30 μM Gd3+ and 300 μM phloretin. (b) Expanded traces of current responses (at arrowhead in a) to step pulses. (c) Instantaneous and steady-state current-voltage relationships measured at the beginning (open circles) and the end (closed circles) of pulses, respectively. (B) Swelling-activated currents recorded from a C127i cell dialyzed with ATP-free pipette solution in the presence of extracellular phloretin (300 μM). (a) Representative record during application of alternating pulses from 0 to ±25 mV (every 10 s) or of step pulses from −50 to +50 mV in 10-mV increments at the arrowhead (protocol is shown in the inset). Horizontal bar indicates times of application of hypotonic solution containing 300 μM phloretin. (b) Expanded traces of current responses (at arrowhead in a) to step pulses. (c) Instantaneous and steady-state I-V relationships measured at the beginning (open circles) and the end (closed circles) of pulses, respectively.

