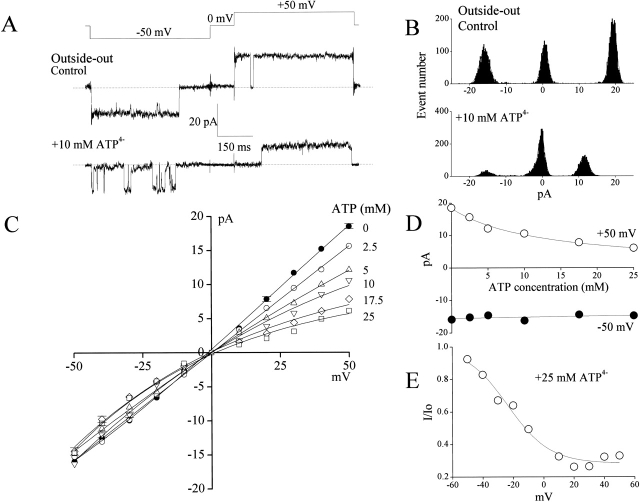
Figure 7.
Open-channel block of large-conductance anion channel by ATP from the extracellular side. Data were obtained from outside-out patches excised from C127i cells. (A) Representative current traces recorded in the absence (control) and presence of 10 mM ATP in the bath during application of step pulses (0.5-s duration) from 0 to ±50 mV (protocol is shown at the top of the traces). Dashed lines indicate zero-current level. (B) Amplitude histograms of single-channel currents shown in A. (C) Unitary current-voltage (i-V) relationships of large-conductance anion channel currents in the absence and presence of varying ATP concentrations in the bath. Each data point represents the mean ± SEM of 5–12 experiments. The SEM values are shown by vertical bars where the values exceed the symbol size. (D) Concentration-inhibition curve of ATP versus single-channel currents recorded at +50 mV (open circles) and −50 mV (closed circles). Data were taken from C. All the SEM values were smaller than the symbol size. Solid lines represent fits to . (E) Voltage-dependent block of the channel by 25 mM ATP. I and I0 represent the channel current amplitude in the presence and absence of 25 mM ATP in the bath, respectively. The solid line represents a fit to .

