
Figure 10.
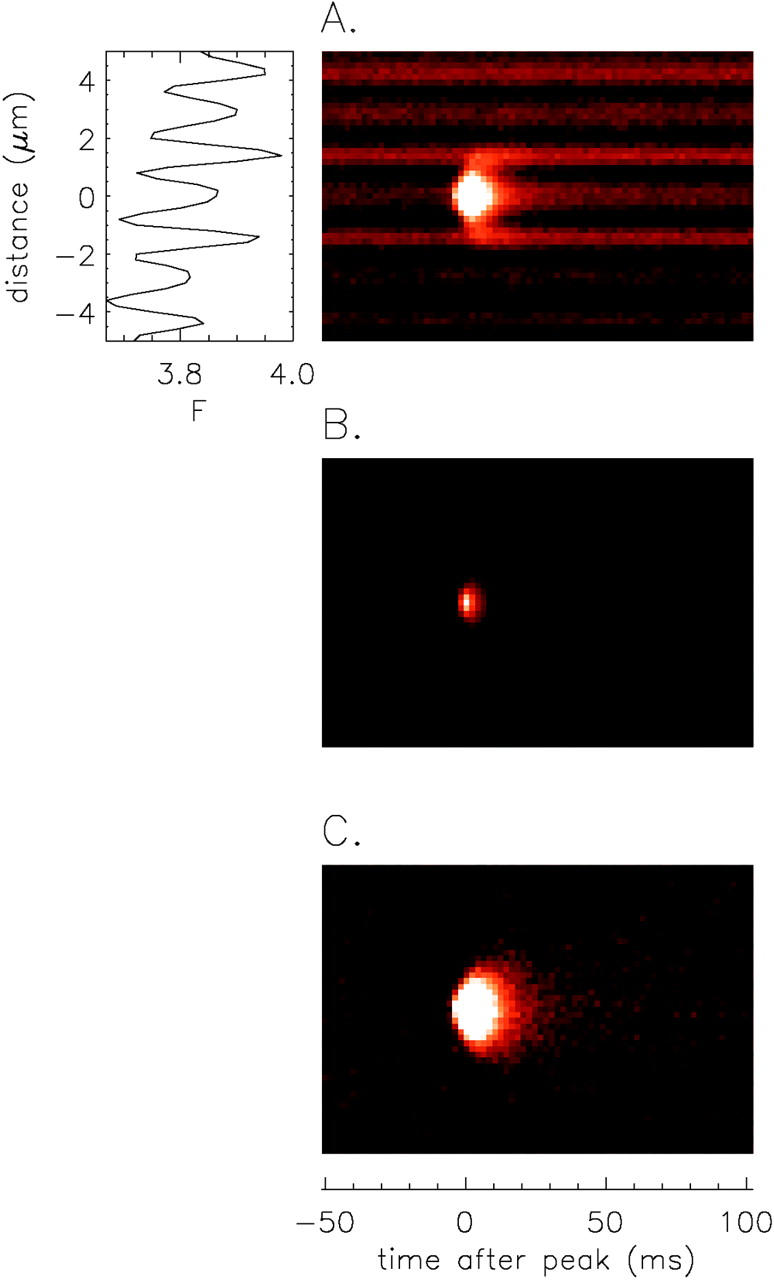
Average x-t images (10.2 μm by 155.6 ms) obtained from 1,767 sparks from R. pipiens in 13 mM [K+] Ringer's (line scan period, 2.048 ms). All analyzed and accepted sparks (materials and methods) were included in the average if (1) rise time was 2–7 ms; (2) amplitude was ≥ 0.7 ΔF/F; (3) no other sparks occurred at the same z-line during the 155.6-ms image period; and (4) a full x-t sub-image containing the spark (10.2 μm by 155.6 ms) was recorded. [Note: the positive late baseline offset criterion (A2 < 0.15; see materials and methods) led to rejection of only one spark from the average.] All sparks were aligned so that the nearest pixel to the fitted time of peak always occurred at t = 0 ms and the nearest pixel to the fitted center of the spark occurred at x = 0 μm. (A) Average F(x,t) image displayed at a high gain to reveal the sarcomeric resting fluorescence pattern, F(x); most of the central pixels of the average spark are in saturation due to the high display gain (see Fig. 11 for amplitude of ΔF/F). The F(x) trace to the left is the average of the first 20 line scans (t < −10 ms); the narrow peaks mark m-lines. (B and C) Average ΔF/F images calculated from the F(x,t) image and the F(x) profile in A. In B, the (ΔF/F)(x,t) image is displayed at low gain; in C, the image is redisplayed at fivefold higher gain to reveal a possible “ember” (see text and Fig. 11).