
Figure 4.
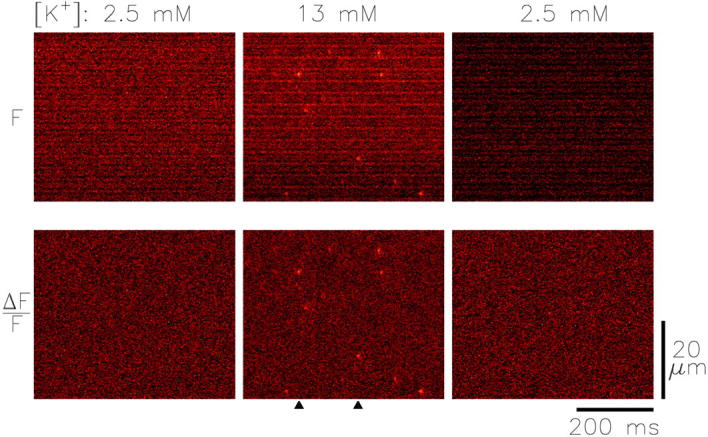
x-t images from a fiber from R. pipiens taken at similar fiber locations in normal Ringer's (left and right) and 13 mM [K+] Ringer's (center). The top row of images are in fluorescence intensity units and the lower row in normalized units (ΔF/F; pseudocolor scales not shown). The mean intensity levels were 3.01, 4.61, and 2.43 counts/μs, and the times after injection were 32, 39, and 107 min (left, center, and right, respectively). Fiber reference, z080200a.