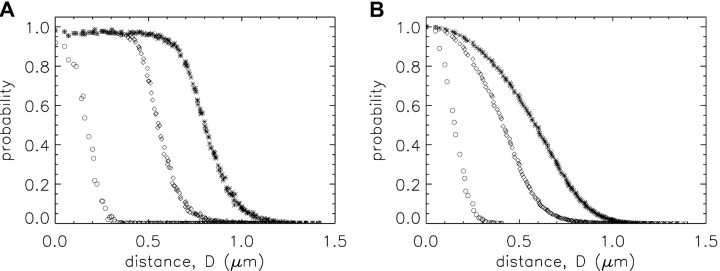
Figure 2.
Probabilities versus D (distance between the spark source and the scan line) for three populations of simulated noisy sparks of different fitted peak amplitudes: ΔF/F ≥ 0.3 (asterisks); ΔF/F ≥ 0.7 (i.e., larger sparks; diamonds); top 10% of larger sparks (i.e., in-focus sparks; circles, for which ΔF/F ≥ 1.55). The results were obtained in Model 2 simulations of 200,000 noisy sparks, as described in materials and methods; the values of Ca2+ flux amplitude and duration were 2.5 pA and 4.6 ms. In A, the ordinate is the probability that a spark at distance D from the scan line satisfies the appropriate amplitude criterion. In B, the ordinate is the probability that the value of D for a spark that satisfies the appropriate amplitude criterion is greater than or equal to the value indicated on the abscissa. In A, the limiting probabilities near 0 μm are slightly <1.0 due to the application of the broad selection criteria given in Hollingworth et al. (2001).

