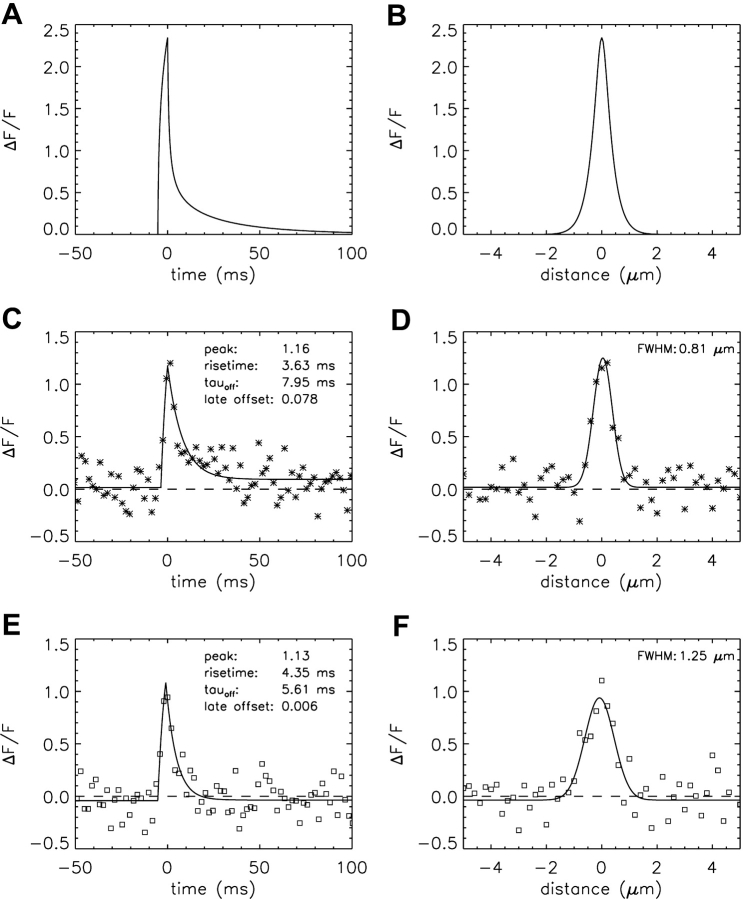
Figure 3.
Simulated and measured spark waveforms in time (left) and in space (right); in the right panels, the distance axis is parallel to the fiber axis (x direction). (A and B) Noise-free ΔF/F waveforms calculated with Model 1 and an SR Ca2+ flux of 3.3 pA for 5.3 ms. The points are aligned so that the time of spark peak is at 0 ms (A) and the spark center is at 0 μm (B). The distance between the simulated line scan and the source is 0 μm in both y and z. The standard waveform averaging procedures used to reduce noise in the noisy spark waveforms in time and space (see materials and methods) were not applied. (C and D) The asterisks show waveforms from a noisy simulated spark at distances from the source of 0.20 and 0.15 μm in y and z, respectively. Sampling is every 2 ms in C and 0.20 μm in D. Noise was added as described in the text. The curves show fits of the standard functions (Hollingworth et al., 2001). In C, the value of FDHM is 8.32 ms. (E and F) Data (squares) and fits for a measured spark, with the amplitude of ΔF/F referred to Normal Ringer's (see materials and methods). Sampling is every 2.048 ms in E and 0.20 μm in F. In E, the value of FDHM is 6.66 ms.

