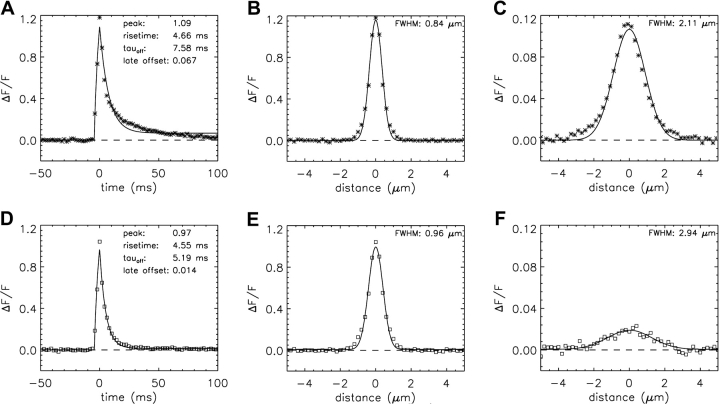
Figure 4.
Temporal and spatial waveforms from 1,767 averaged simulated (A–C) and measured (D–F) larger sparks. In the simulations, which were made with Model 1, the amplitude and duration of the Ca2+ source flux were 3.3 pA and 5.3 ms. In A and D, the values of FDHM are 8.57 and 6.56 ms, respectively. In B and E, the spatial waveforms were determined at the time of spark peak. In C and F, the spatial waveforms were averaged over the period 28–48 ms after peak; the fitted amplitudes are ΔF/F = 0.107 and 0.018, respectively.

