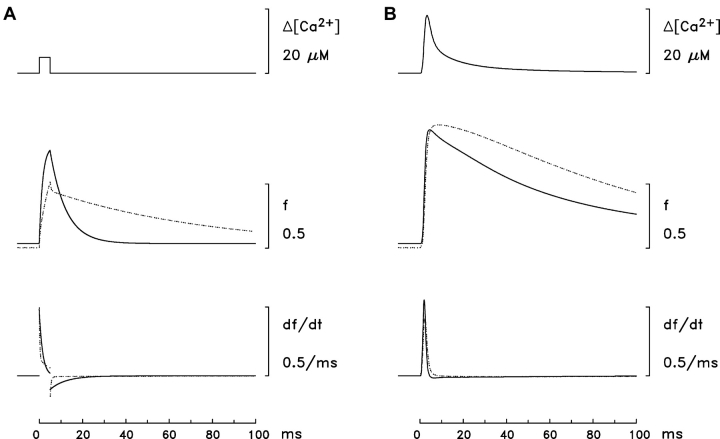
Figure 5.
Single-compartment calculations that illustrate some of the kinetic differences between the Ca2+ troponin reactions of Models 1 and 2, [Ca2+]R = 50 nM. (A) The top trace top shows a 5-ms pulse in [Ca2+] from 50 nM to 5 μM. The middle traces show the time courses of f, the fraction of the troponin regulatory sites that are occupied with Ca2+ (continuous trace, Model 1 troponin; dotted trace, Model 2 troponin). The bottom traces show the time derivative of the middle traces. (B) Like A for the spatially-averaged free [Ca2+] transient from Baylor and Hollingworth (1998). The peak amplitude and FDHM of the [Ca2+] transient are 18.0 μM and 5.3 ms, respectively.

