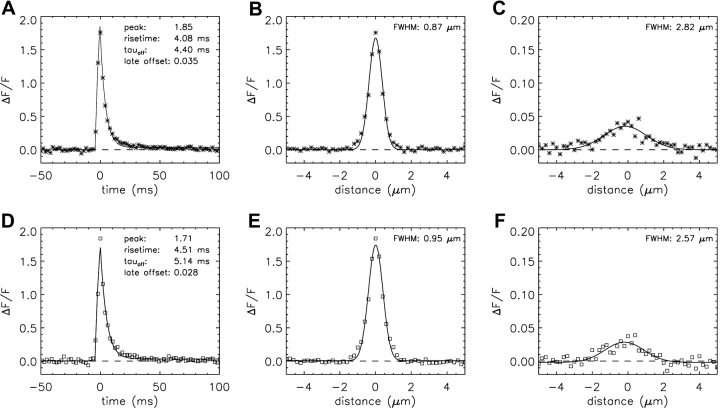
Figure 9.
Temporal and spatial waveforms obtained from the average of 179 in-focus sparks; the format is the same as that in Figs. 4 and 7. (A–C) Model 2 simulations with a SR Ca2+ flux of 2.5 pA for 4.6 ms; (D–F) measurements. The values of FDHM are 5.64 ms (A) and 6.51 ms (D). In C and F, the fitted amplitudes of ΔF/F are 0.035 and 0.032, respectively.

