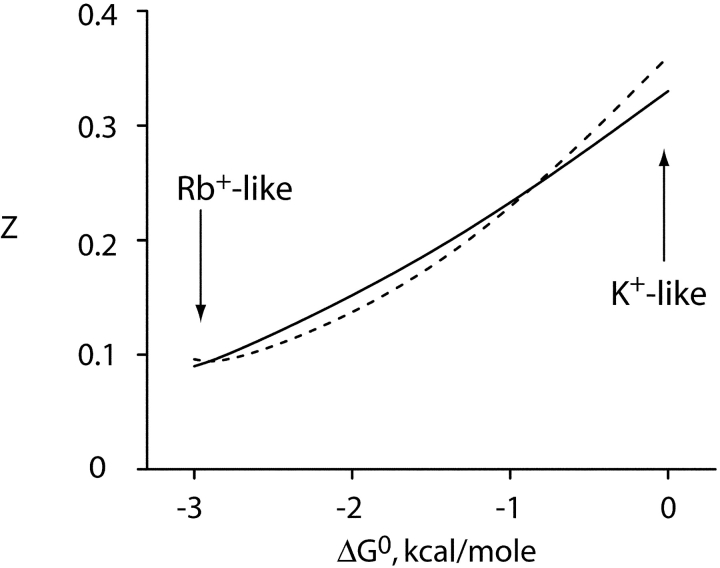
Figure 9.
Effective valence of simulated Na+ block varies with energy landscape. The scheme of Fig. 8 B was used to simulate Na+ block of permeant ion current. Effective valence of block, z, was calculated by applying Eqs. 1 and 2 to the simulated data over a voltage range of 0–200 mV, and this parameter is plotted against the free energy difference, Go, between outer and inner configurations. The scheme was implemented in MATLAB, using transition rate constants of the form: kij = kij(0)exp(−zijFV/RT). Thermodynamic cycles were balanced and zero voltage first-order rate constants were set to unity at ion concentrations equivalent to the KD value. (solid curve) no repulsion (β = 1); (dashed curve) repulsion included (β = 100). For the simulations illustrated here, charge movement for entry into the vacant vestibule was 0.2, and that of configuration-shifting of the ions in the selectivity filter was 0.4. These values fix the voltage dependences of the other transitions. Voltage dependences of the rate constants were partitioned equally into forward and backward steps.

