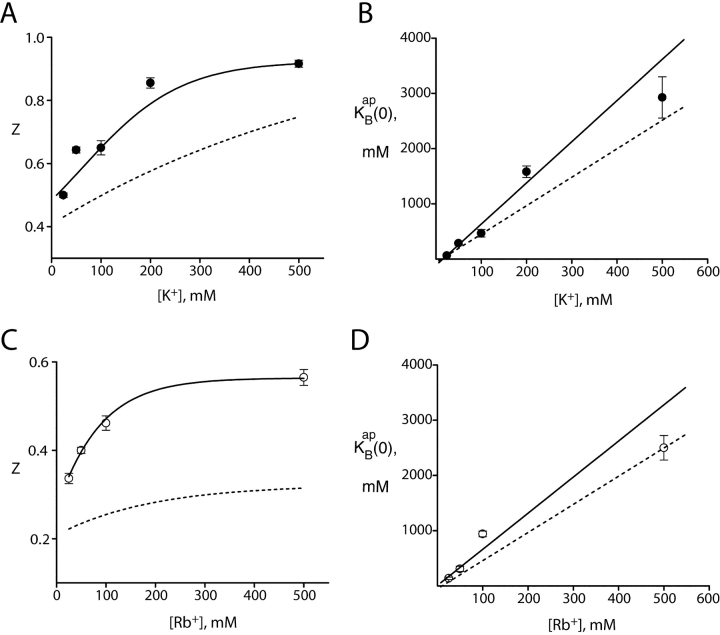
Figure 7.
Blocking parameters derived from kinetic analysis. I-V curves in K+ (A and B) and Rb+ (C and D) were analyzed by Eq. 5 over the entire voltage range, as in Figs. 2 and 4. The blocking parameters z and  were averaged from individual datasets, as in Fig. 6. The solid curves through z (A and C) have no theoretical significance; solid lines through
  (B and D) represent linear fits as in Fig. 6, with slopes of 7.5 for K+ and 6.5 for Rb+. The dashed curves are taken directly from Fig. 6, for comparison of parameters obtained in the two analysis methods.

