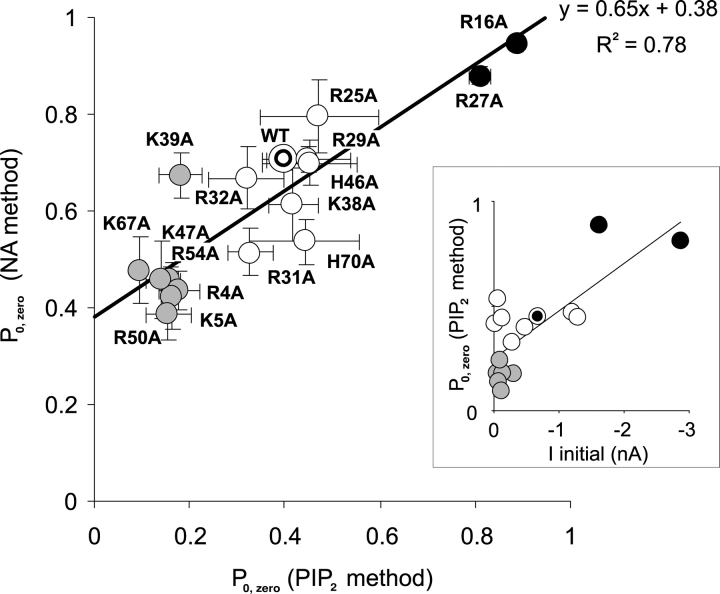
Figure 4.
Initial open probability in zero ATP (Po,zero) obtained from noise analysis (NA method, mean ± SEM, n = 3–8) plotted versus Po,zero obtained from subsequent increase in current following PIP2 addition (PIP2 method, mean ± SEM). The solid line is a least squares fit to the mean data as indicated. The insert shows mean Po,zero (PIP2 method) plotted against Iinitial (from Fig. 1 B) for each mutant.

