
Figure 6.
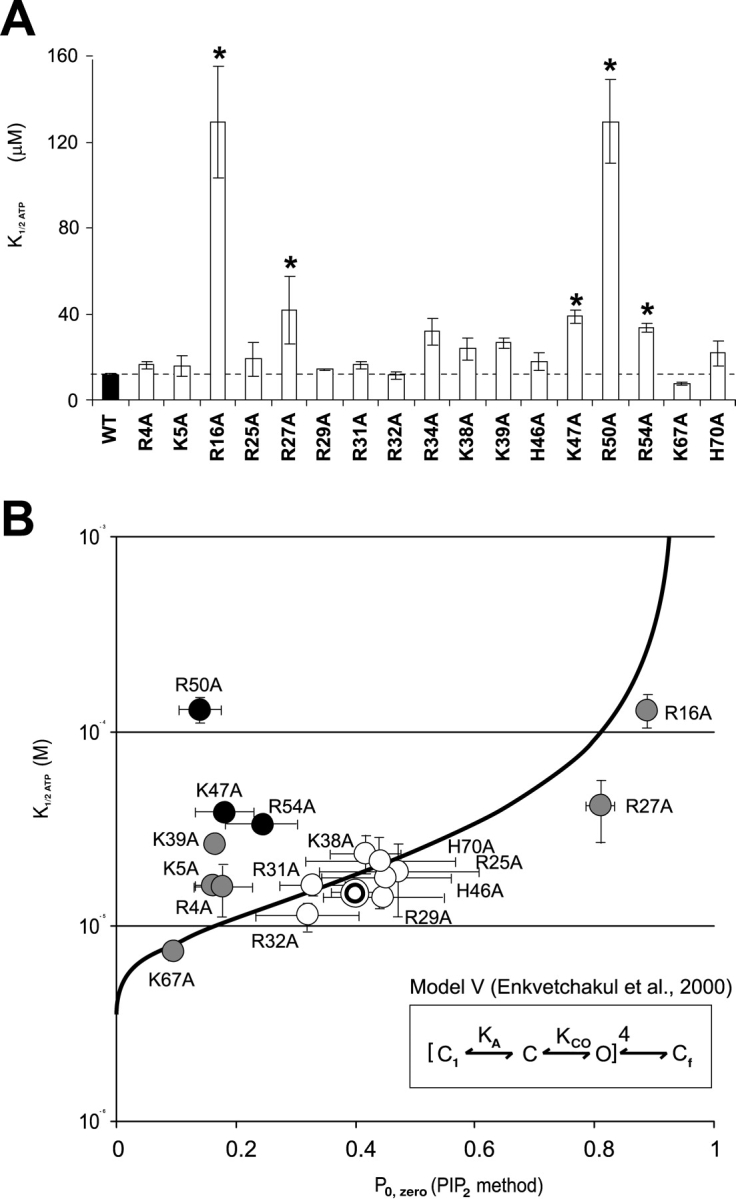
(A) Mean K1/2ATP for each mutant immediately following patch excision (mean ± SEM, n = 3–9, asterisk indicates less ATP-sensitive than WT, P < 0.05). Dose-response curves were obtained from recordings like those in Figs. 2 and 3 and were fit using a Hill equation (relative current = 1/{1 + ([ATP]/K1/2)H}) with K1/2,ATP = [ATP] causing half-maximal inhibition and H = 1.3. (B) K1/2,ATP versus Po,zero for each mutant (mean ± SEM, n = 3–9; for each parameter). The double circle represents mean values for WT. For different Kir6.2 mutant constructs, gray/black indicates Po,zero significantly different than WT (P < 0.05). The heavy line represents predicted Po,zero versus K1/2,ATP relationship calculated from Model V of Enkvetchakul et al. (2000)(see insert), black indicates mutants with K1/2,ATP significantly different than that predicted from the estimated Po,zero (P < 0.05).