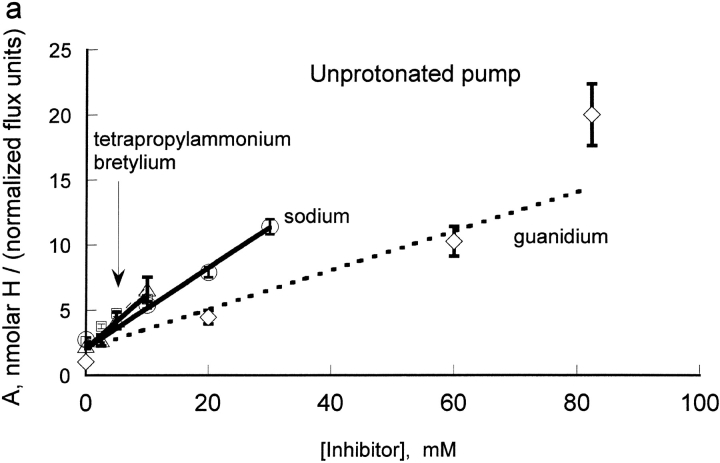
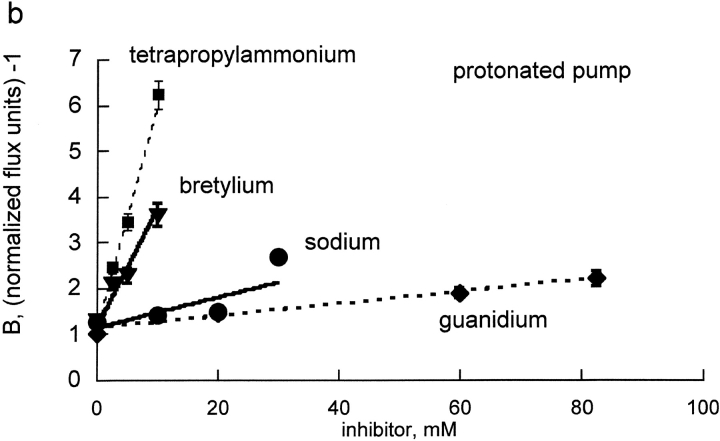
Figure 4.
(a) Replot of A for bretylium, guanidinium, sodium, and tetrapropylammonium versus inhibitor concentrations. The values of A were determined from the plots in Fig. 3. The slope of this line is proportional to the Ki for each inhibitor, for binding to the unprotonated pump. All four lines have similar slope, implying that all four inhibitors bind with similar affinity to the unprotonated pump. The slopes were: bretylium (triangles), 0.392 ± 0.078; guanidinium (diamonds), 0.175 ± 0.014; sodium (circles), 0.271 ± 0.037; tetrapropylammonium (squares), 0.364 ± 0.063. (b) Replot of B for bretylium, guanidinium, sodium, and tetrapropylammonium versus inhibitor concentrations. The values of B were determined from the plots in Fig. 3. The slope of this line is proportional to the Li for each inhibitor, for binding to the protonated pump. Clearly Na and guanidinium have very little affinity for the protonated pump and bretylium and TPA have substantial affinity. The slopes were: bretylium (triangles), 0.282 ± 0.019; guanidinium (diamonds), 0.016 ± 0.001; sodium (circles), 0.040 ± 0.006; tetrapropylammonium (squares), 0.517 ± 0.016.


