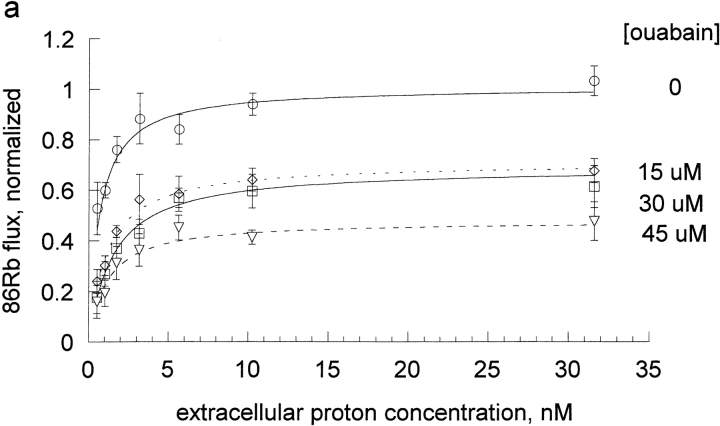
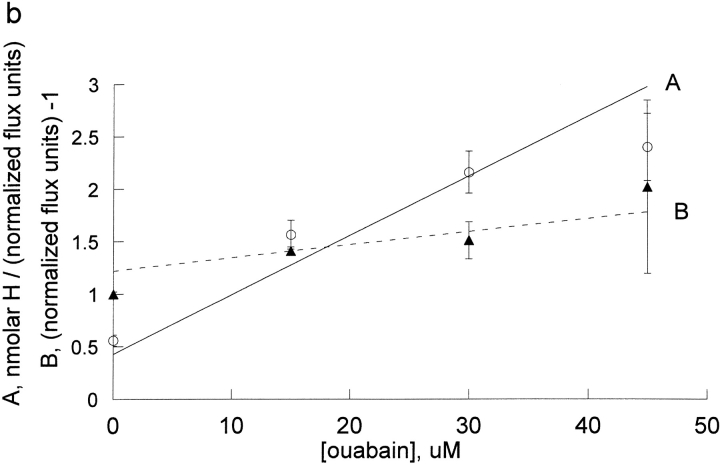
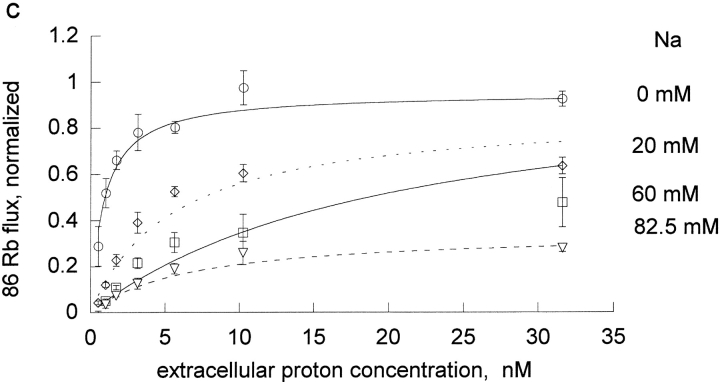
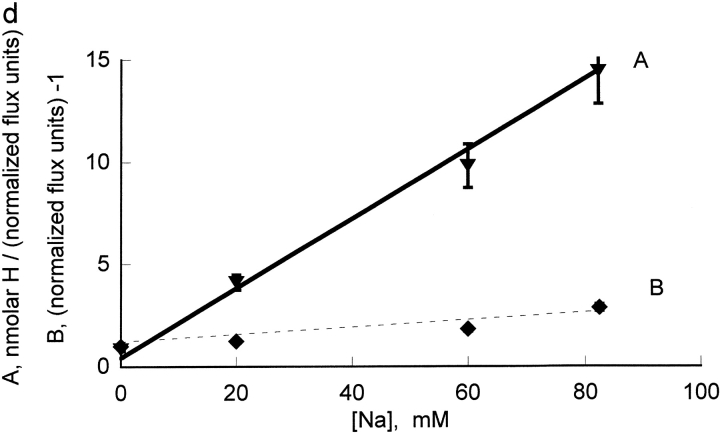
Figure 5.
The effect of ouabain and sodium on the proton activation of Rb influx in DIDS treated rat red blood cells. The experimental procedure was similar to that described in Fig. 3 and the results of 3 separate experiments pooled as described in Fig. 3. The data were fit to the equation, v = H/[A + B * H] at each inhibitor concentration (panels a and c) and the values of A and B replotted vs. I (panels b and d). Note that the x axis for ouabain is in micromolar in this panel b, reflecting the substantially higher affinity for ouabain than for the sodium and the inhibitors in Fig. 4. The slope for ouabain binding in the absence of protons was 0.0566 ± 0.0043 and in the presence of protons was 0.0124 ± 0.0023. The slope for ouabain binding in the absence of protons was 0.17 ± 0.011 and in the presence of protons was 0.12 ± 0.012.


