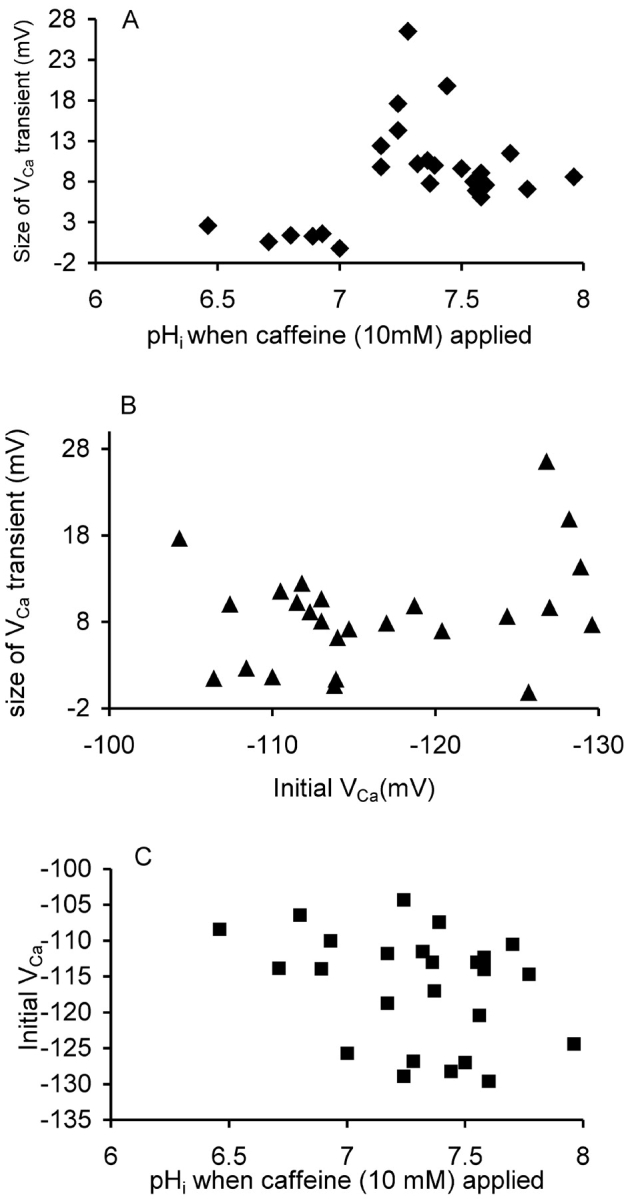
Figure 6.

Caffeine-induced calcium release at different pHi. (A) The size of the transient change in VCa occurring within 60 s of the start of 25 applications of 10 mM caffeine onto three different cells is plotted against the pHi at the time of application. (B) The size of the transient change in VCa plotted against the VCa at the time of application. (C) The initial VCa and pHi when the caffeine applications were made. Data from three experiments in which caffeine was applied a total of 25 times.
