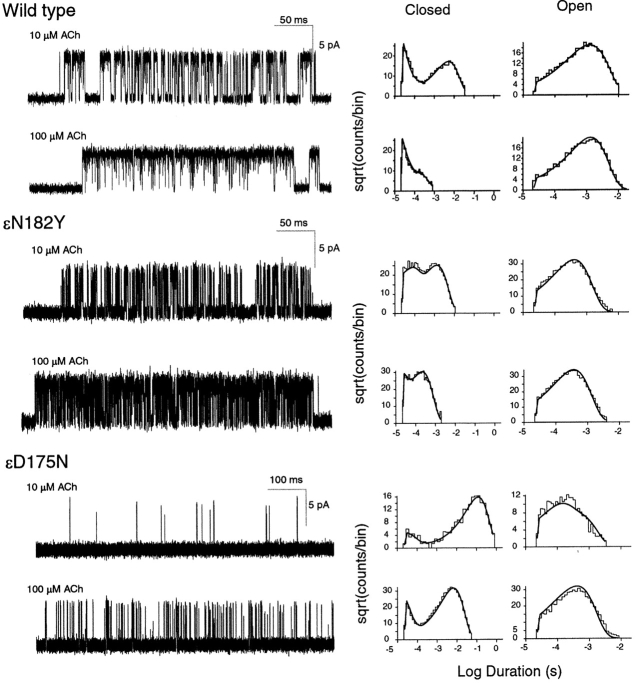
Figure 3.
Kinetics of activation of wild-type and mutant receptors. Left column displays individual clusters of single channel currents recorded at the indicated ACh concentrations from cells expressing adult human AChRs containing the indicated mutant ɛ subunits. Currents are displayed at a bandwidth of 10 kHz, with channel openings shown as upward deflections. Center and right columns display the corresponding closed and open duration histograms with the fits for Scheme I superimposed. Fitted rate constants are given in Table III.

