
Figure 6.
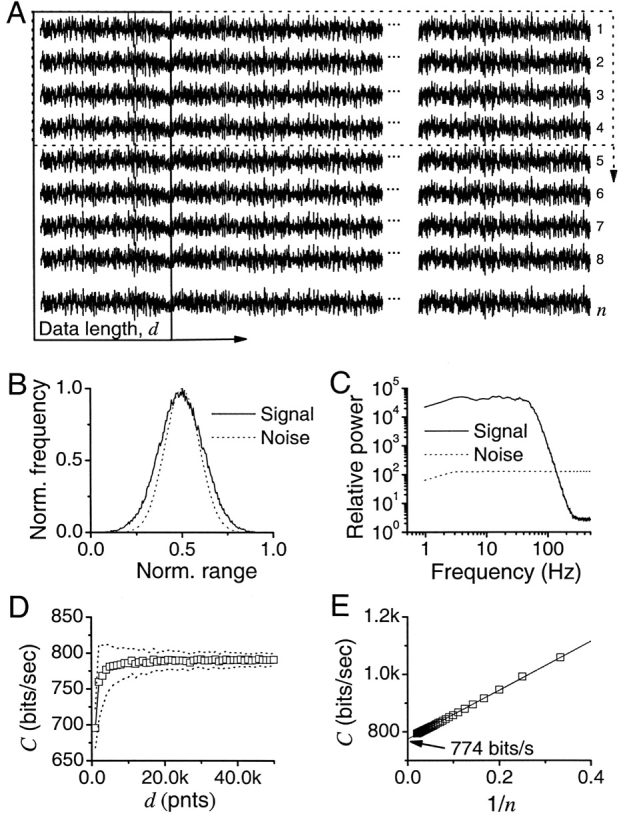
Calculation of information capacity, C. (A) Synthesized traces with Gaussian signal and Gaussian additive noise. Pass-band and stop-band for the signal are 70 and 120 Hz, respectively, whereas the noise is white. C (see Eq. 7) is estimated by using both different data lengths, d (indicated by the box with the arrow pointing right), and the number of trials, n (indicated by the dotted box with the arrow pointing down). (B) For long simulations with many repetitions, the signal and noise distributions are Gaussian. (C) Corresponding signal and noise power spectra. (D) C increases with the length of the data. Mean and SD shown. (E) Number of trials affects C; calculated from the data having 50,000 points. C is extrapolated by using the linear trend as  .
.