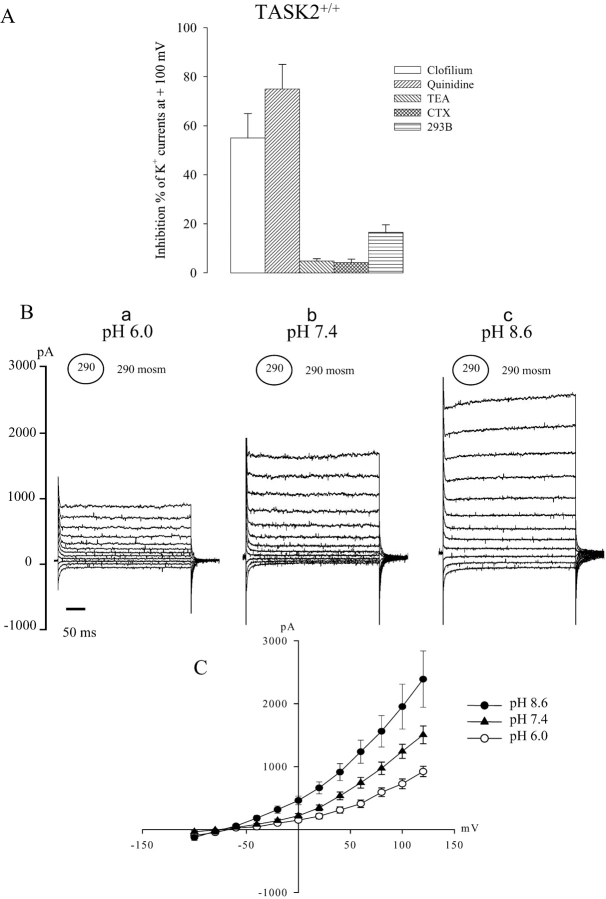
Figure 5.
(A) Histogram of percent inhibition of different K+ channel inhibitors on swelling-activated K+ currents recorded in PCT cells from TASK2 +/+ mice. Membrane voltage was held at −50 mV and stepped to test potential values between −100 and +120 mV in 20-mV increments. Whole-cell currents were recorded 4–5 min after extracellular perfusion of a 290-mosmol/kg H2O hypotonic solution in the presence of 10 μM clofilium, 0.5 mM quinidine, 1 mM TEA, 10 nM CTX, and 10 μM 293B. Values measured 200 ms after onset of pulse at 100 mV are converted to percent inhibition. Each value is mean ± SEM of (n) cells obtained from six monolayers. (B) Effect of extracellular pH on the development of swelling-activated K+ currents in cultured PCT cells from TASK2 +/+ mice. Under each experimental condition, the circled values represent the osmotic pressure in the pipette and the values outside the circle represent the osmotic pressure in the extracellular bath solutions. Membrane voltage was held at −50 mV and stepped to test potential values between −100 and +120 mV in 20-mV increments. (Ba, Bb, and Bc) Whole-cell currents were recorded 4–5 min after extracellular perfusion of a 30% hypotonic solution at pH 6.0, 7.4, and 8.6, respectively, in the presence of 5 mM EGTA and 5 mM Mg-ATP in the pipette solution. (C) Corresponding average current-voltage relationships measured 200 ms after onset of pulse, obtained from same cell at rest and during hypotonic stimulation at pH 6.0, 7.4, and 8.6. Values are means ± SEM of (n) cells obtained from five monolayers.

