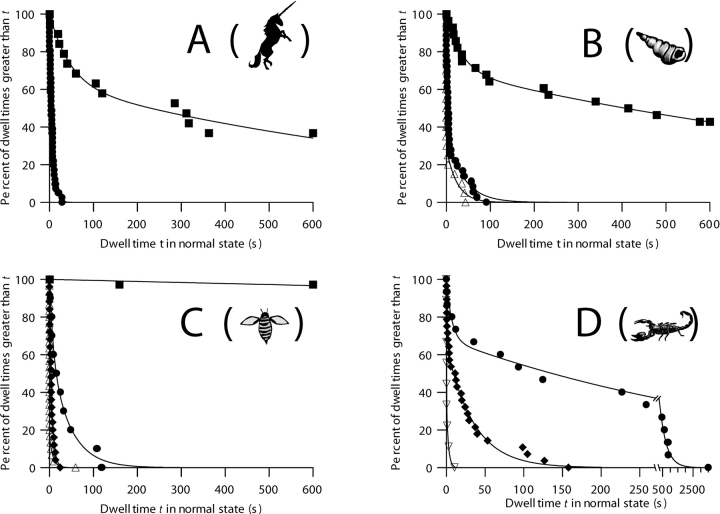
Figure 7.
Survival plots illustrating the effects of voltage and disulfide bond reduction on the transition rate of C-domain with each of the peptide stoppers. Each curve represents a series of dwell times measured at the same voltage. The measurements at different voltages for a given unreduced stopper are all from a single membrane; the measurements for each reduced stopper were obtained on a different single membrane. Unreduced stoppers: ▪, +40 mV; •, +90 mV; ♦, +110 mV. Reduced stoppers: ▵, +70 mV; ▿, +80 mV. Parameters have the same meanings as described in Fig. 6. The data at +40 mV in A, B, and C are the same as described in Fig. 6, so the fitting parameters are not repeated here. (A) Peptide U. +90 mV, n = 41, τ = 6.33 s. (See Fig. 8 for the effect of disulfide bond reduction.) (B) α-Conotoxin. +90 mV, n = 36, τ1 = 2.6 s, τ2 = 38 s, A = 63%. +70 mV, reduced, n = 20, τ1 = 0.07 s, τ2 = 24 s, A = 71%. (C) Apamin. +90 mV, n = 10, τ1 = 8 s, τ2 = 44 s, A = 37%. +110 mV, n = 25, τ1 = 0.1 s, τ2 = 5.6 s, A = 12%. +70 mV, reduced, n = 30, τ1 = 0.045 s, τ2 = 8 s, A = 84%. The +90 mV apamin data may be biased toward shorter dwell times, because several transitions that occurred with multiple open channels in the normal state were excluded from the analysis. (D) CTX. Note the change of scale at the break in the time axis. +90 mV, n = 15, τ1 = 7 s, τ2 = 440 s, A = 32%. +110 mV, n = 28, τ1 = 1.3 s, τ2 = 35 s, A = 35%. +80 mV, reduced, n = 9, τ1 = 0.19 s, τ2 = 2 s, A = 64%. For all of the stoppers, the rate of transition to the small-conductance state is conspicuously voltage dependent, with faster transitions at larger positive voltages. Disulfide bond reduction, which allows the stoppers to unfold, also greatly increased the transition rates. For the folded stoppers, the solutions were the same as described in Fig. 1; for the unfolded stoppers, both the cis and trans solutions also contained 1–20 mM TCEP.

