
Figure 8.
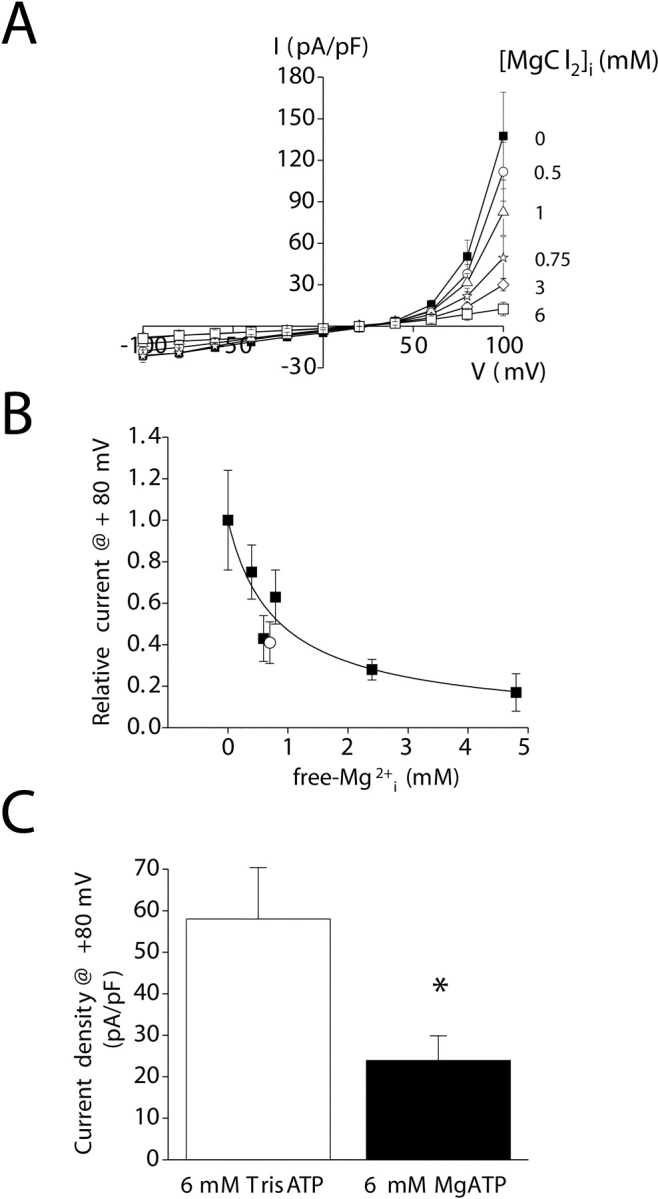
Inhibition of the outwardly rectifying cation current by intracellular Mg2+. (A) I–V relationships for cells patch clamped with ATP- and GTP-free pipette solutions containing 0–6 mM MgCl2. Chloride concentrations in the solutions were maintained constant by addition of 0–12 mM NMDGCl. EGTA was replaced with 10 mM BAPTA to buffer intracellular Ca2+ at 14 nM. Note that the Mg2+ concentrations indicated on the figure are those added to the pipette solution. Therefore, 0 Mg2+ should be considered nominally Mg2+ free. (B) Dose–response relationship for inhibition of the outwardly rectifying current by intracellular free Mg2+. Data were fit using the equation I = 1/1 + ([Mg2+]/K1/2)n. K1/2 and n are 692 μM and 0.8, respectively. Open circle is inhibition observed when free Mg2+ concentration is elevated by addition of 6 mM MgATP. (C) Effect of Mg2+ nucleotides on the outwardly rectifying cation current. Whole-cell current is inhibited ∼60% by 6 mM MgATP. Calculated concentration of free Mg2+ in the pipette solution containing 6 mM MgATP is 700 μM. The degree of inhibition is similar to that observed when free Mg2+ is elevated by addition of MgCl2 (see B). *, P < 0.05 (compared with 6 mM TrisATP). Values are means ± SEM (n = 5–9). Currents were measured in standard bath medium containing both Ca2+ and Mg2+ 3–4 min after obtaining whole-cell access when activation was complete. Voltage clamp protocol was the same as described in Fig. 2.