
Figure 13.
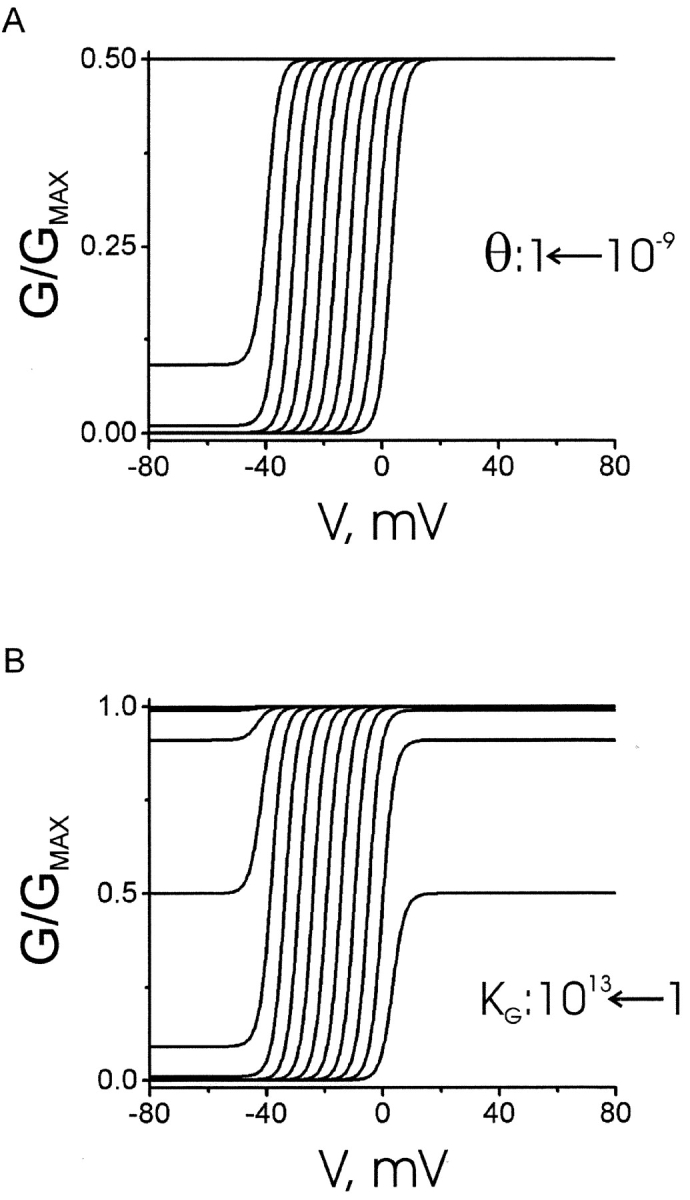
Simulations of G-V curves. (A) Simulated G-V curves with different coupling strength using equation 4, where KS = 10−9, KG = 1, and Z = 12, whereas θ is varied from 10−9 to 1 (right to left) in 10-fold increments. (B) Simulated G-V curves with the gating transition in different equilibria, where KS = 10−9, θ = 10−9, and Z = 12, whereas KG is varied from 1 to 1013 (right to left) in 10-fold increments.