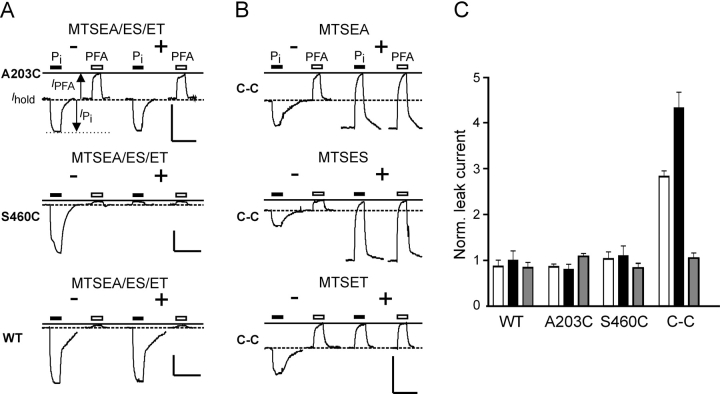
Figure 2.
Effect of MTS reagents on electrogenic response of C-C mutant. (A) Representative current recordings from oocytes that expressed the single mutants A203C, S460C, and WT NaPi-IIa, before and after incubation in 100 μM MTSEA, MTSES, or MTSET (data shown only for MTSEA as MTSET and MTSES gave similar records). Traces show responses of oocytes to 1 mM Pi (filled bar) and 3 mM PFA (open bar) applied for the period indicated, before (−, left traces) and after (+, right traces) incubation. The continuous line indicates the holding current level reached during the initial PFA application. Dashed line represents holding current (I hold) in ND100 solution. Note that for each cell, the recording baseline levels were not adjusted before and after MTSEA exposure. Note the quantification of transport modes as indicated: substrate-induced currents (I PFA, I Pi) are measured relative to I hold. Uniport or leak activity is then given by −I PFA and the cotransport activity is given by I Pi − I PFA. We assume that these substrate concentrations are sufficient to inhibit fully the leak current and that both transport modes are mutually exclusive. Bars: vertical, 50 nA; horizontal, 20 s. (B) Recordings from oocytes expressing the double mutant A203C-S460C (C-C) before (−, left traces) and after (+, right traces) incubation for 3 min with 100 μM MTSEA, MTSES, or MTSES. Note that for the double mutant, the leak current increases only in the presence of MTSEA and MTSES. Bars: vertical, 50 nA; horizontal, 20 s. (C) Pooled data for the leak for oocytes expressing WT, A203C, S460C, and C-C mutant after incubation with MTSEA (white bars), MTSES (black bars), or MTSET (gray bars). Each data point represents mean of five oocytes, normalized to the value before MTS exposure.

