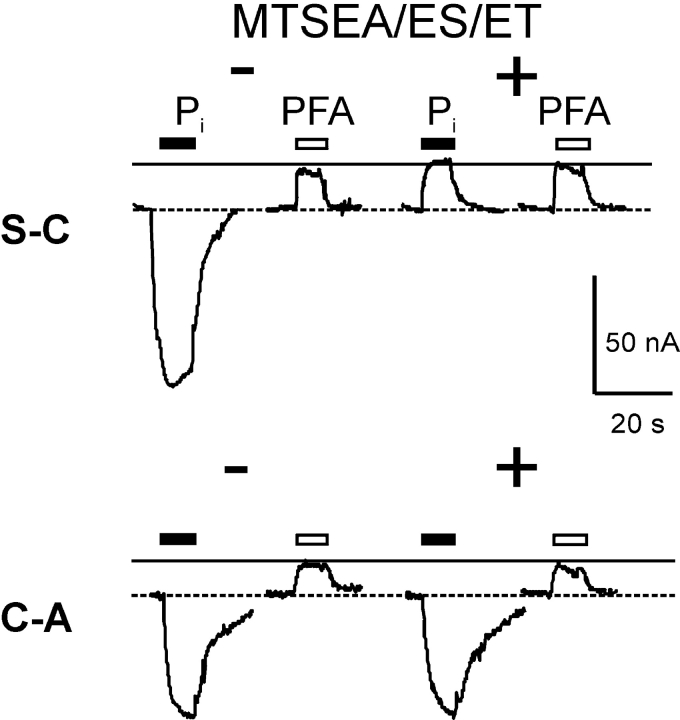
Figure 5.
Effect of MTS reagents on electrogenic response of functional double mutants with single novel Cys. Representative current recordings from oocytes that expressed S-C and C-A mutants before (−, left traces) and after (+, right traces) incubation for 3 min with 10 μM MTSEA, MTSES, or MTSET (data shown for MTSEA). Each oocyte was tested with 1 mM Pi (filled bar) and 3 mM PFA (open bar) for the period indicated. The continuous line indicates level reached during the initial PFA application. Dashed line represents baseline current in ND100 solution. Note that for each cell, the recording baseline levels were not adjusted before and after MTSEA exposure.

